Cartographic scale defines the relationship between a distance on a map and the corresponding distance on the ground, crucial for accurate spatial representation. Understanding scale ensures your map conveys precise geographic information, whether for navigation, planning, or analysis. Explore the rest of the article to learn how different types of scales impact your map's usability.
Table of Comparison
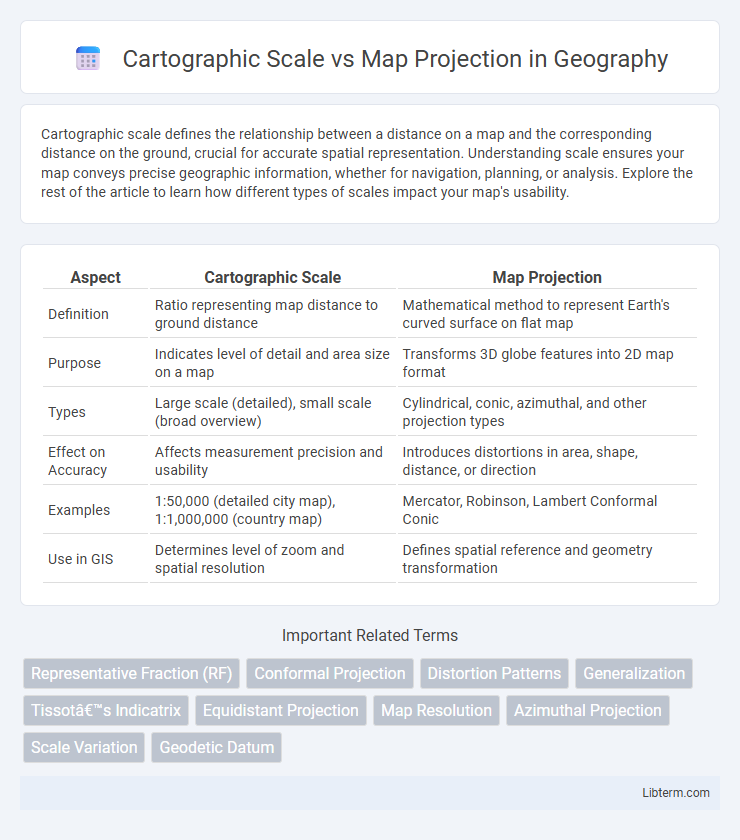
| Aspect | Cartographic Scale | Map Projection |
|---|---|---|
| Definition | Ratio representing map distance to ground distance | Mathematical method to represent Earth's curved surface on flat map |
| Purpose | Indicates level of detail and area size on a map | Transforms 3D globe features into 2D map format |
| Types | Large scale (detailed), small scale (broad overview) | Cylindrical, conic, azimuthal, and other projection types |
| Effect on Accuracy | Affects measurement precision and usability | Introduces distortions in area, shape, distance, or direction |
| Examples | 1:50,000 (detailed city map), 1:1,000,000 (country map) | Mercator, Robinson, Lambert Conformal Conic |
| Use in GIS | Determines level of zoom and spatial resolution | Defines spatial reference and geometry transformation |
Introduction to Cartographic Scale and Map Projection
Cartographic scale defines the relationship between distances on a map and corresponding distances on the ground, often expressed as a representative fraction or graphic scale. Map projection involves transforming the curved surface of the Earth onto a flat plane, inherently causing distortions in shape, area, distance, or direction. Understanding cartographic scale and map projection is essential for interpreting spatial data accurately and selecting appropriate mapping techniques for different geographic analyses.
Defining Cartographic Scale: Key Concepts
Cartographic scale defines the relationship between distances on a map and their corresponding distances on the ground, often expressed as a ratio or fraction such as 1:50,000. This key concept establishes the level of detail and spatial extent visible, influencing accuracy and usability for different mapping purposes. Understanding cartographic scale ensures the correct interpretation of geographic features and supports effective map projection choices to minimize distortion.
Understanding Map Projections: An Overview
Understanding map projections involves recognizing how the Earth's curved surface is represented on a flat map, which inherently distorts some spatial properties like area, shape, distance, or direction. Cartographic scale defines the relationship between distances on the map and corresponding distances on the ground but operates independently from the choice of map projection. Selecting an appropriate map projection depends on the purpose of the map and the need to preserve specific properties, while the scale remains a consistent ratio reflecting the level of detail.
Types of Cartographic Scales in Mapping
Cartographic scales in mapping include verbal scales, representative fractions (RF), and graphic scales, each serving to express the relationship between distances on a map and real-world measurements. Verbal scales describe this relationship in words, such as "1 inch equals 1 mile," while representative fractions use a ratio or fraction like 1:24,000 to indicate scale. Graphic scales, or bar scales, provide a visual means to measure distance on maps regardless of reproduction size changes, enhancing accuracy in spatial analysis and navigation.
Common Map Projections and Their Characteristics
Common map projections include Mercator, Lambert Conformal Conic, and Robinson, each offering unique characteristics suited for different cartographic purposes. The Mercator projection preserves angles and shapes near the equator but distorts area significantly toward the poles, making it ideal for navigation but less accurate for size comparison. Lambert Conformal Conic maintains shape and area better over mid-latitude regions, making it suitable for aeronautical charts, while the Robinson projection balances size and shape distortions to produce visually appealing world maps.
The Relationship Between Scale and Projection
Cartographic scale directly influences the level of detail and accuracy represented on a map, while map projection affects the distortion of geographic features during the transformation from a 3D globe to a 2D surface. The relationship between scale and projection determines how spatial relationships such as distance, area, and shape are maintained or altered, impacting the map's suitability for specific applications. Selecting an appropriate projection depends on the map scale, as large-scale maps require projections that minimize local distortions, whereas small-scale maps prioritize preserving global spatial properties.
Effects of Scale on Map Accuracy and Detail
Cartographic scale directly influences map accuracy by determining the level of detail and spatial resolution visible, with large-scale maps providing finer detail and more precise measurements compared to small-scale maps. Map projections introduce distortions in area, shape, distance, or direction, and the impact of these distortions varies with scale; larger scales can minimize distortion effects within smaller geographic extents, while small-scale maps often exhibit more noticeable projection inaccuracies over broader areas. Selecting an appropriate combination of cartographic scale and map projection is crucial to balance accuracy and usability for specific geographic applications.
Distortion in Map Projections: Causes and Impacts
Map projections cause distortion by transforming the three-dimensional Earth surface onto a two-dimensional plane, resulting in changes to area, shape, distance, or direction. Different projection methods prioritize accuracy in specific properties, leading to trade-offs such as conformal projections preserving angles while distorting area, or equal-area projections maintaining area but altering shapes. These distortions impact geographic interpretation, navigation, and spatial analysis by affecting the reliability of distances, spatial relationships, and thematic representations on maps.
Choosing the Right Scale and Projection for Your Map
Selecting the right cartographic scale and map projection is crucial for accurately representing geographic data. Large-scale maps provide detailed, localized views ideal for city planning, while small-scale maps cover broader areas such as countries or continents but with less detail. Projection choice depends on the map's purpose: conformal projections preserve shapes for navigation, equal-area projections maintain area proportions for statistical analysis, and compromise projections balance distortions for general reference.
Conclusion: Best Practices in Cartographic Representation
Effective cartographic representation balances the choice of scale and map projection to optimize accuracy and usability. Selecting an appropriate cartographic scale ensures detail is presented clearly without overwhelming the map's readability, while choosing a map projection minimizes distortion specific to the geographical area and purpose. Integrating scale and projection decisions based on the map's intended use yields the most precise and user-friendly spatial visualization.
Cartographic Scale Infographic