Gradient describes the rate of change of a quantity, often used in mathematics and physics to represent how a function varies across space. It plays a crucial role in fields such as machine learning, where gradients guide optimization algorithms during training. Explore the article to understand how gradients impact various applications and enhance your knowledge on this fundamental concept.
Table of Comparison
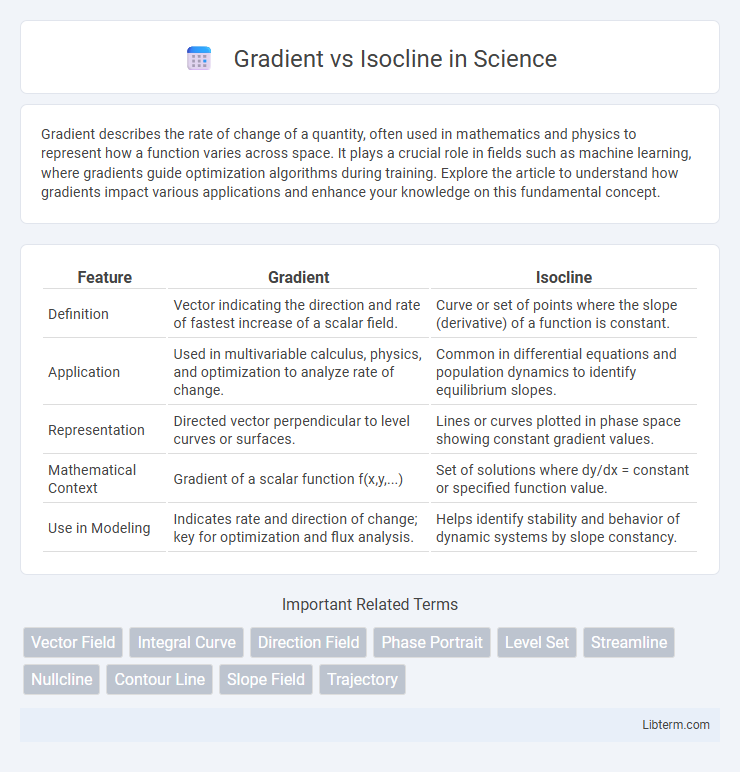
| Feature | Gradient | Isocline |
|---|---|---|
| Definition | Vector indicating the direction and rate of fastest increase of a scalar field. | Curve or set of points where the slope (derivative) of a function is constant. |
| Application | Used in multivariable calculus, physics, and optimization to analyze rate of change. | Common in differential equations and population dynamics to identify equilibrium slopes. |
| Representation | Directed vector perpendicular to level curves or surfaces. | Lines or curves plotted in phase space showing constant gradient values. |
| Mathematical Context | Gradient of a scalar function f(x,y,...) | Set of solutions where dy/dx = constant or specified function value. |
| Use in Modeling | Indicates rate and direction of change; key for optimization and flux analysis. | Helps identify stability and behavior of dynamic systems by slope constancy. |
Introduction to Gradient and Isocline
Gradient represents the rate of change or slope of a function, indicating the direction and magnitude of the steepest ascent in a multidimensional space. Isoclines are curves that connect points where the slope of a differential equation or function remains constant, often used to analyze phase planes and solution behavior. Understanding gradients helps quantify directional change, while isoclines provide insights into the geometric structure and stability of dynamical systems.
Definitions: Gradient vs Isocline
Gradient refers to the rate of change or slope of a function, indicating the steepness and direction in a multidimensional space. An isocline is a curve or line in a differential equation where the slope or derivative has a constant value, representing points with equal gradient magnitude. While the gradient describes local directional change, the isocline maps out the set of points sharing the same slope in the solution field.
Mathematical Foundations
Gradient represents a vector field indicating the direction and rate of the steepest ascent of a scalar function, mathematically defined as the vector of partial derivatives. Isoclines are curves or surfaces where a differential equation's slope field maintains a constant value, often used to analyze solutions by setting dy/dx equal to a constant in the equation. The gradient's role in multivariable calculus underpins the definition of isoclines in planar systems by characterizing directional derivatives and flow patterns.
Geometric Interpretation
Gradient represents the direction and rate of the steepest increase of a scalar field, visualized as a vector perpendicular to level curves or surfaces. Isoclines are curves where the slope of a differential equation remains constant, providing geometric insight into solution trajectories. While gradients emphasize change magnitude and direction, isoclines help identify slope patterns crucial for understanding solution behavior in phase space.
Applications in Differential Equations
Gradient vectors indicate the direction of the steepest increase of a scalar function and are crucial in solving partial differential equations by providing information about rate and direction changes. Isoclines represent curves where the slope of a differential equation is constant, facilitating qualitative analysis of solution behaviors and phase plane trajectories in first-order differential equations. Both tools enhance the understanding and visualization of solution structures, essential in mathematical modeling across physics, engineering, and biology.
Visualization Techniques
Gradient visualization techniques use vector fields to represent the rate and direction of change in scalar functions, often displayed as color-coded arrows or contour maps indicating slope intensity and orientation. Isocline visualization focuses on curves or lines connecting points of equal slope or derivative values, aiding in the analysis of differential equations and phase plane behavior. Combining gradient fields with isoclines enhances the interpretation of complex systems by highlighting directional trends alongside critical threshold boundaries.
Key Differences between Gradient and Isocline
Gradient represents the rate and direction of the steepest ascent or descent in a scalar field, commonly expressed as a vector indicating magnitude and direction. Isocline, on the other hand, is a curve or set of points in a differential equation's phase plane where the slope or derivative is constant, often used to analyze solution behavior visually. The key difference lies in gradient's vector nature describing change in multivariate functions versus isocline's role as a geometric locus of constant slope in differential system analysis.
Advantages and Limitations
Gradient methods provide a clear direction for steepest ascent or descent, enabling efficient optimization and solving differential equations with variable rates of change. Isoclines, defined by constant slope values, simplify the analysis of differential equations by highlighting regions of uniform behavior and facilitating phase plane analysis. Gradient techniques may struggle with non-smooth functions or high-dimensional spaces, while isoclines can become complex or impractical in multi-dimensional systems due to overlapping curves and intricate geometries.
Real-World Examples
Gradient represents the rate of change in a field, such as temperature variation on a weather map, where it indicates the direction and steepness of increasing temperature. Isoclines are curves that connect points with the same slope in differential equations, often visualized in population dynamics to predict growth behavior under constant rates. For instance, in ecology, gradient maps help track environmental changes, while isocline diagrams assist in understanding predator-prey interactions by showing stable population conditions.
Conclusion and Summary
Gradient represents the rate of change and direction of a function's steepest ascent, crucial for optimization and differential analysis. Isoclines are curves connecting points with equal slope or derivative values, useful for visualizing solution behaviors in differential equations. Understanding both concepts enhances interpretation of dynamic systems, with gradients guiding optimization paths and isoclines mapping constant-rate trajectories.
Gradient Infographic