Isotherms represent lines or curves on a graph that connect points of equal temperature, crucial for visualizing heat distribution in various scientific fields such as meteorology, thermodynamics, and engineering. Understanding isotherms helps analyze temperature gradients, predict weather changes, or optimize thermal systems by indicating how heat spreads or concentrates within a medium. Explore the rest of the article to learn how isotherms influence practical applications and enhance your grasp of temperature-related phenomena.
Table of Comparison
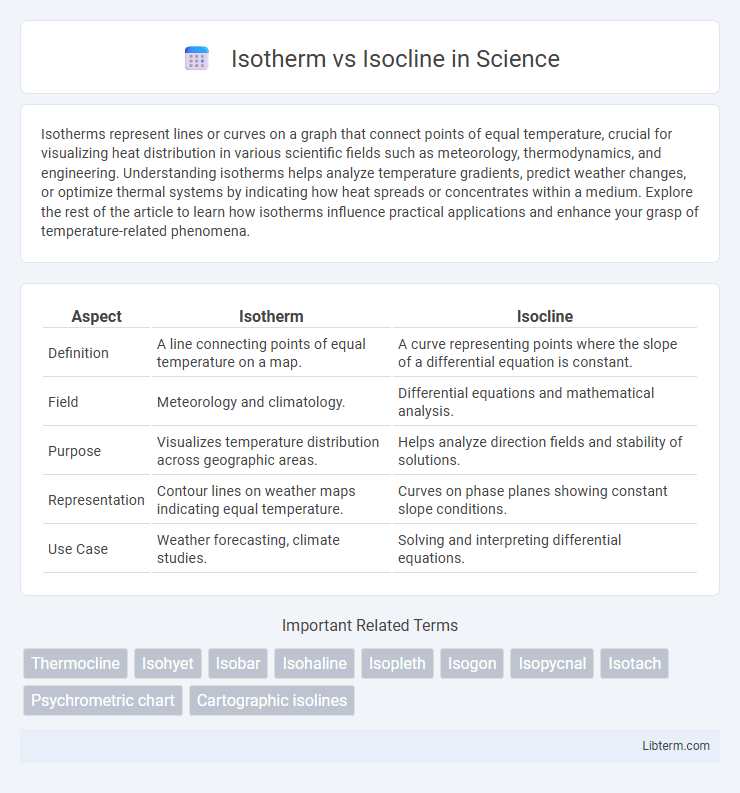
| Aspect | Isotherm | Isocline |
|---|---|---|
| Definition | A line connecting points of equal temperature on a map. | A curve representing points where the slope of a differential equation is constant. |
| Field | Meteorology and climatology. | Differential equations and mathematical analysis. |
| Purpose | Visualizes temperature distribution across geographic areas. | Helps analyze direction fields and stability of solutions. |
| Representation | Contour lines on weather maps indicating equal temperature. | Curves on phase planes showing constant slope conditions. |
| Use Case | Weather forecasting, climate studies. | Solving and interpreting differential equations. |
Introduction to Isotherms and Isoclines
Isotherms are lines on a map connecting points of equal temperature, essential for visualizing temperature distribution across geographic areas. Isoclines, in contrast, represent lines of equal slope or gradient, commonly used in ecological and mathematical models to analyze dynamic systems. Understanding Isotherms and Isoclines is crucial for meteorology and ecology, as they provide insights into temperature patterns and system behavior, respectively.
Defining Isotherms: Key Concepts
Isotherms are lines on a weather map connecting points with equal temperature, providing a clear visualization of temperature distribution across a geographic area. These contours help meteorologists track temperature gradients and identify regions of thermal stability or change. Understanding isotherms is crucial for analyzing climate patterns, weather forecasting, and studying atmospheric conditions.
Isoclines Explained: What You Need to Know
Isoclines are curves on a graph representing points where a differential equation has constant slope, crucial for analyzing direction fields in systems of differential equations. Unlike isotherms, which map lines of constant temperature on a physical surface, isoclines help visualize solution behavior and stability in mathematical models. Understanding isoclines enables better predictions of dynamic systems' trajectories and equilibrium points in fields such as ecology or engineering.
Mathematical Representation of Isotherms
Isotherms are mathematically represented as contour lines connecting points of equal temperature on a graph or map, typically defined by the equation T(x,y) = C, where T denotes temperature and C is a constant value. In contrast, isoclines describe curves where the slope of a differential equation remains constant, expressed as dy/dx = m for a fixed slope m. The precise mathematical delineation of isotherms aids in thermal analysis and meteorological modeling, distinguishing them from the slope-oriented isocline curves used in differential equations.
Mathematical Representation of Isoclines
Isoclines, defined as curves where the slope of a differential equation's solution remains constant, are mathematically represented by setting dy/dx equal to a constant m and solving f(x, y) = m. This approach contrasts with isotherms, which denote lines of constant temperature rather than slope in a solution field. The isocline equation facilitates analyzing solution direction fields, revealing the behavior of differential equations through the family of curves specified by dy/dx = m.
Applications of Isotherms in Science
Isotherms are widely used in meteorology and climatology to map temperature distributions across geographic regions, aiding in weather forecasting and climate studies. In environmental science, isotherms help analyze heat transfer in oceans, contributing to understanding marine ecosystems and global warming effects. Industrial applications include monitoring temperature uniformity in chemical processes and material manufacturing, ensuring quality control and process optimization.
Applications of Isoclines in Science
Isoclines are vital in differential equations to analyze solution curves where slopes remain constant, significantly aiding population dynamics modeling and ecological stability studies. Their application extends to economics for equilibrium analysis and in engineering for systems control and phase plane analysis. Isotherms, in contrast, primarily map temperature distributions and are less focused on dynamic system behavior.
Key Differences Between Isotherms and Isoclines
Isotherms are lines on a map connecting points of equal temperature, commonly used in meteorology to illustrate temperature distribution patterns, while isoclines are contour lines representing points of equal slope in mathematical graphs or equal growth rates in biology. Isotherms reflect spatial temperature variations and aid in weather forecasting, whereas isoclines analyze differential equations or population dynamics by indicating consistent rate changes. The primary difference lies in their application domains and the variables they represent--temperature for isotherms and slope or growth rates for isoclines.
Visualizing Isotherms and Isoclines: Graphical Insights
Isotherms and isoclines provide crucial graphical insights by visually representing temperature gradients and slope stability, respectively, across geographic or mathematical contexts. Isotherms connect points of equal temperature on weather maps, helping meteorologists analyze climate patterns, while isoclines link points where the slope of a differential equation solution remains constant, aiding mathematicians in understanding system behavior. Visualizing these lines enhances interpretation of dynamic changes, enabling precise analysis in meteorology and differential equations.
Conclusion: Choosing Between Isotherms and Isoclines
Choosing between isotherms and isoclines depends on the specific data analysis focus: isotherms map temperature distributions, crucial for meteorology and climatology, while isoclines represent curves of constant slope in differential equations, essential for understanding solution behaviors in mathematical modeling. Isotherms provide spatial temperature insights that guide weather prediction and climate study, whereas isoclines facilitate the graphical analysis of differential equations by indicating equilibrium conditions or critical points. Selecting the appropriate curve type enhances accuracy in interpreting temperature patterns or dynamic system solutions based on the disciplinary context.
Isotherm Infographic