Isotherms represent lines on a map or graph connecting points with equal temperature, providing critical insights in meteorology and thermodynamics. Understanding isotherms helps analyze temperature distribution patterns, assess climate behavior, and optimize thermal systems. Explore the rest of the article to discover how isotherms influence weather forecasting and industrial applications.
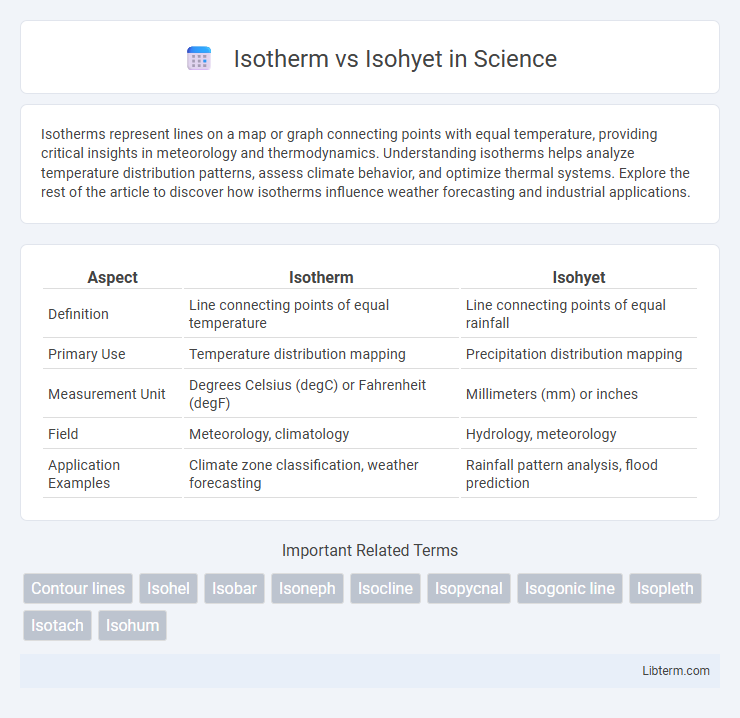
Table of Comparison
| Aspect | Isotherm | Isohyet |
|---|---|---|
| Definition | Line connecting points of equal temperature | Line connecting points of equal rainfall |
| Primary Use | Temperature distribution mapping | Precipitation distribution mapping |
| Measurement Unit | Degrees Celsius (degC) or Fahrenheit (degF) | Millimeters (mm) or inches |
| Field | Meteorology, climatology | Hydrology, meteorology |
| Application Examples | Climate zone classification, weather forecasting | Rainfall pattern analysis, flood prediction |
Introduction to Isotherms and Isohyets
Isotherms are lines on a map connecting points with equal temperature, crucial for understanding climate patterns and weather forecasting. Isohyets connect points with equal rainfall, aiding meteorologists and hydrologists in analyzing precipitation distribution and water resources. Both isotherms and isohyets enable spatial visualization of temperature and rainfall variations, facilitating environmental and agricultural planning.
Definition of Isotherm
An isotherm is a line on a weather map connecting points of equal temperature, providing a clear visualization of temperature distribution across a geographic area. Isohyets, in contrast, are lines connecting points of equal precipitation, essential for mapping rainfall patterns. Understanding isotherms is crucial for meteorological analysis, climate studies, and weather forecasting.
Definition of Isohyet
Isohyet refers to a contour line on a map that connects points of equal precipitation, primarily used in meteorology and hydrology to represent rainfall distribution across a region. Unlike isotherms, which indicate areas of equal temperature, isohyets provide critical data for analyzing spatial patterns of rainfall intensity and accumulation. Mapping isohyets helps in water resource management, flood forecasting, and agricultural planning by illustrating precipitation gradients accurately.
Key Differences Between Isotherm and Isohyet
Isotherms represent lines on a map that connect points of equal temperature, while isohyets link points receiving equal precipitation. Isotherms are essential in climate analysis to understand temperature distribution, whereas isohyets are crucial for studying rainfall patterns and water resource management. The primary difference lies in the variable measured: temperature for isotherms and precipitation for isohyets.
Importance in Meteorology and Geography
Isotherms represent lines of equal temperature on weather maps, crucial for analyzing temperature distribution and identifying climatic patterns important in meteorology and geography. Isohyets are contour lines connecting points of equal precipitation, essential for understanding rainfall distribution, water resource management, and flood risk assessment. Both tools enable accurate spatial analysis in weather forecasting, climate studies, and environmental planning.
Applications of Isotherms
Isotherms, which represent lines of equal temperature on a map, are extensively used in meteorology to analyze climate patterns and forecast weather changes. They facilitate the study of heat distribution across geographic regions, aiding in agricultural planning and energy management by identifying temperature zones favorable for crop growth or energy consumption. Unlike isohyets, which depict rainfall distribution, isotherms provide critical insights into thermal variations that influence ecological dynamics and human activities.
Applications of Isohyets
Isohyets, lines connecting points of equal rainfall on weather maps, are critical for hydrological studies and agricultural planning by enabling precise assessment of precipitation distribution. These contours assist meteorologists and environmental scientists in flood risk analysis, water resource management, and designing efficient irrigation systems. Mapping isohyets contributes to soil conservation efforts by identifying regions vulnerable to erosion due to uneven rainfall patterns.
Methods of Creating Isotherm and Isohyet Maps
Isotherm maps are created by plotting temperature data collected from weather stations and connecting points with equal temperature using interpolation methods such as kriging or spline interpolation to produce smooth temperature gradient lines. Isohyet maps are generated by measuring precipitation levels at various locations and linking points of equal rainfall, typically using hypsometric or Thiessen polygon methods to accurately depict spatial precipitation variations. Both mapping techniques rely on geostatistical analysis and spatial data visualization to represent climatic patterns effectively.
Challenges in Interpreting Isotherms vs Isohyets
Interpreting isotherms can be challenging due to temporal temperature fluctuations and spatial variability, which may lead to ambiguous thermal gradient representations. In contrast, isohyets present difficulties in accurately mapping precipitation distribution because of uneven rainfall patterns, measurement errors, and topographic influences. Both require precise data interpolation and consideration of climatic complexities to ensure reliable meteorological analysis.
Conclusion: Choosing Between Isotherm and Isohyet
Isotherms and isohyets serve distinct purposes in climate and hydrological studies, with isotherms mapping temperature distribution and isohyets depicting rainfall intensity. Selecting between them hinges on the specific environmental variable of interest--temperature patterns demand isotherms, while precipitation analysis requires isohyets. Accurate application of these isolines enhances meteorological data interpretation and informs effective environmental planning.
Isotherm Infographic