Logarithmic functions are essential for understanding exponential relationships and solving equations involving growth or decay. These functions transform multiplicative processes into additive ones, simplifying complex calculations in fields like engineering, finance, and computer science. Explore the rest of the article to deepen your understanding of logarithmic applications and their practical uses.
Table of Comparison
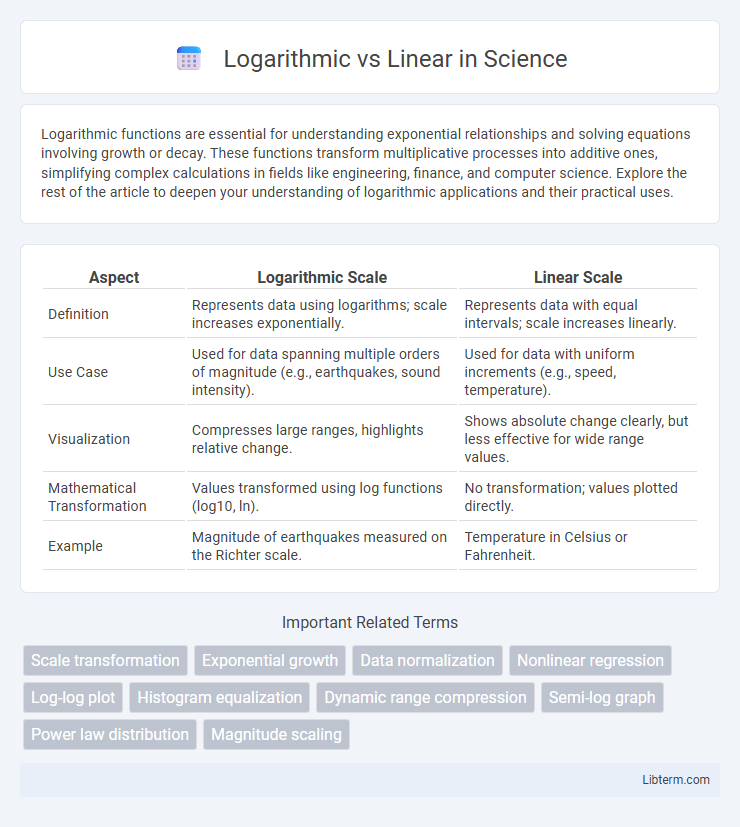
| Aspect | Logarithmic Scale | Linear Scale |
|---|---|---|
| Definition | Represents data using logarithms; scale increases exponentially. | Represents data with equal intervals; scale increases linearly. |
| Use Case | Used for data spanning multiple orders of magnitude (e.g., earthquakes, sound intensity). | Used for data with uniform increments (e.g., speed, temperature). |
| Visualization | Compresses large ranges, highlights relative change. | Shows absolute change clearly, but less effective for wide range values. |
| Mathematical Transformation | Values transformed using log functions (log10, ln). | No transformation; values plotted directly. |
| Example | Magnitude of earthquakes measured on the Richter scale. | Temperature in Celsius or Fahrenheit. |
Introduction to Logarithmic and Linear Scales
Logarithmic scales measure data based on orders of magnitude, representing values as exponents of a base number, often 10, which is ideal for displaying wide-ranging data such as earthquake magnitudes or sound intensities. Linear scales, by contrast, show equal intervals representing equal absolute differences, making them suitable for data with uniform increments like temperature or time. Understanding these differences is critical for accurately interpreting data trends and magnitudes in scientific and financial contexts.
What Are Linear Scales?
Linear scales represent data using equal intervals along the axis, where each unit increase corresponds to a constant addition in value, making them ideal for displaying data with uniform changes. They are commonly used when comparing quantities that change at a steady rate, such as time, distance, or temperature. Linear scales provide clear visualization for datasets without exponential growth or large value disparities, ensuring proportional representation of differences between data points.
Understanding Logarithmic Scales
Logarithmic scales represent data by orders of magnitude rather than fixed increments, making them essential for visualizing phenomena with exponential growth or wide-ranging values, such as earthquake magnitudes or sound intensity. Unlike linear scales, where equal distances correspond to equal differences, logarithmic scales plot equal distances as equal ratios, enhancing clarity in datasets spanning multiple scales. Understanding logarithmic scales improves data interpretation by highlighting relative changes and reducing distortion caused by extreme values.
Key Differences: Logarithmic vs Linear
Logarithmic scales represent data that covers a wide range of values by compressing large numbers into smaller, manageable increments, making them ideal for exponential growth patterns such as population or sound intensity. Linear scales maintain equal intervals between values, suitable for data with uniform changes and constant differences, like temperature or distance. The key difference lies in their interval representation: logarithmic scales use multiplicative steps, while linear scales use additive steps, impacting data visualization and interpretation significantly.
Real-World Applications of Linear Scales
Linear scales are essential in real-world applications where uniform measurement intervals are critical, such as in engineering, construction, and manufacturing processes that require precise dimensional accuracy. They facilitate clear visualization of proportional relationships in data sets with consistent incremental changes, making them ideal for tracking speed, temperature, and voltage in everyday devices. Unlike logarithmic scales, linear scales simplify interpretation and comparison when data values increase at a steady rate rather than exponentially.
When to Use Logarithmic Scales
Logarithmic scales are ideal for data spanning several orders of magnitude, such as earthquake magnitudes, sound intensity, or financial growth rates, where exponential changes occur. They enhance visualization of percentage changes and relative differences, making patterns clearer in skewed or wide-ranging datasets. Linear scales work best for data with uniform intervals and smaller value ranges, ensuring proportional representation without distortion.
Data Visualization: Logarithmic vs Linear
Logarithmic scales in data visualization emphasize relative change and multiplicative factors, making them ideal for datasets spanning multiple orders of magnitude, such as population growth or earthquake magnitudes. Linear scales represent absolute differences uniformly, providing clarity for evenly distributed data but can obscure significant variations in rapidly changing values. Choosing between logarithmic and linear scales depends on the nature of the data and the insights one aims to highlight in visual analysis.
Advantages and Limitations of Linear Scales
Linear scales provide a straightforward representation of data by maintaining equal intervals between values, which simplifies the interpretation of measurements and emphasizes absolute differences. They are advantageous for displaying data with a uniform range and when the focus is on the magnitude of changes rather than proportional differences. However, linear scales have limitations in handling wide-ranging data since large values can dominate the visualization, making small variations less distinguishable, and are less effective in representing exponential growth or multiplicative relationships compared to logarithmic scales.
Pros and Cons of Logarithmic Scales
Logarithmic scales efficiently represent data spanning several orders of magnitude, making it easier to visualize exponential growth and percentage changes, which is particularly useful in fields like finance and science. However, they can be less intuitive for general audiences, potentially causing misinterpretation of absolute differences and requiring logarithmic understanding. While linear scales provide straightforward interpretation of equal increments, logarithmic scales offer advantages in handling skewed data and highlighting relative change rather than absolute values.
Choosing the Right Scale for Your Data
Choosing the right scale for your data depends on the distribution and range of the values; logarithmic scales are ideal for data spanning several orders of magnitude or exhibiting exponential growth, as they compress wide ranges into manageable visuals. Linear scales suit datasets with uniform intervals and limited range, providing straightforward interpretation where each unit change represents the same absolute difference. Proper scale selection enhances data clarity, aids accurate pattern recognition, and prevents misleading conclusions in charts and graphs.
Logarithmic Infographic