Deadlock occurs when two or more processes are unable to proceed because each is waiting for the other to release resources, causing a standstill in the system. Understanding the conditions that lead to deadlock, such as mutual exclusion, hold and wait, no preemption, and circular wait, is crucial for effective system design and process management. Explore the rest of this article to learn how to detect, prevent, and resolve deadlocks in your computing environment.
Table of Comparison
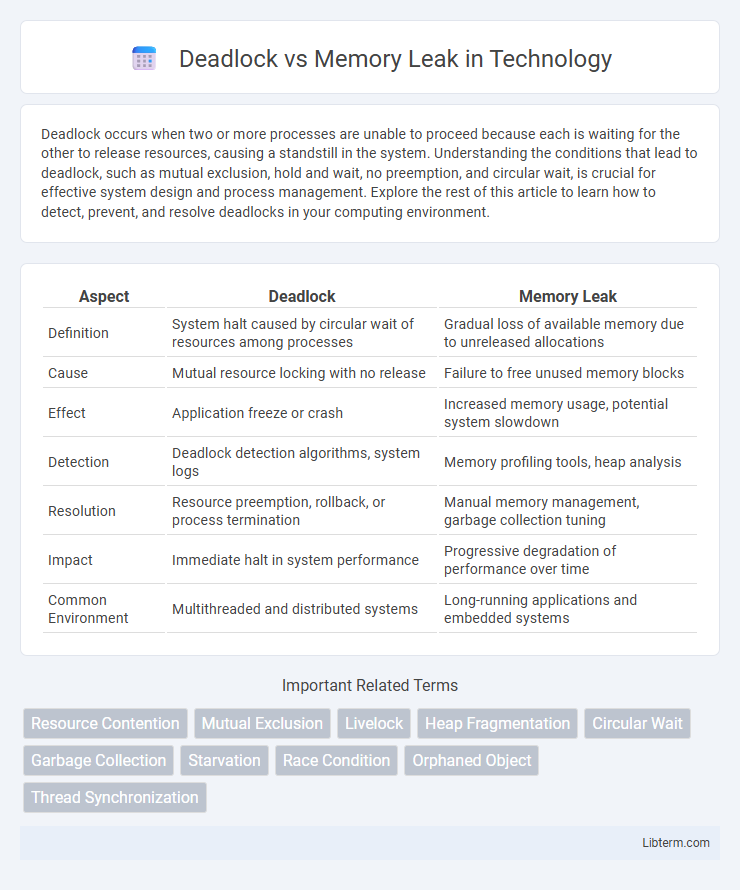
| Aspect | Deadlock | Memory Leak |
|---|---|---|
| Definition | System halt caused by circular wait of resources among processes | Gradual loss of available memory due to unreleased allocations |
| Cause | Mutual resource locking with no release | Failure to free unused memory blocks |
| Effect | Application freeze or crash | Increased memory usage, potential system slowdown |
| Detection | Deadlock detection algorithms, system logs | Memory profiling tools, heap analysis |
| Resolution | Resource preemption, rollback, or process termination | Manual memory management, garbage collection tuning |
| Impact | Immediate halt in system performance | Progressive degradation of performance over time |
| Common Environment | Multithreaded and distributed systems | Long-running applications and embedded systems |
Introduction to Deadlock and Memory Leak
Deadlock occurs when two or more processes are unable to proceed because each is waiting for the other to release resources, causing a complete halt in program execution. Memory leak happens when a program continuously allocates memory without releasing it, leading to reduced system performance and potential crashes. Understanding these issues is critical for efficient resource management and system stability in software development.
Defining Deadlock: Causes and Characteristics
Deadlock occurs when two or more processes are unable to proceed because each is waiting for resources held by the other, causing a complete halt in system operations. Common causes include circular wait conditions, hold-and-wait scenarios, and lack of resource preemption, which lead to mutual resource blocking. Characteristics of deadlock involve resource contention, process starvation, and system-wide freezes that degrade performance and require intervention for resolution.
Understanding Memory Leak: Symptoms and Consequences
Memory leaks occur when a program allocates memory but fails to release it after use, causing a gradual increase in memory consumption that can lead to system slowdowns or crashes. Symptoms include excessive memory usage, reduced application performance, and eventual out-of-memory errors. Consequences of memory leaks involve degraded user experience, increased operational costs due to resource inefficiency, and potential system instability requiring application restarts or debugging interventions.
Key Differences Between Deadlock and Memory Leak
Deadlock occurs when two or more processes are stuck waiting indefinitely for resources held by each other, causing a system halt, while a memory leak involves the continuous allocation of memory without proper release, leading to reduced available memory and performance degradation. Deadlock primarily affects process synchronization and system responsiveness, whereas memory leaks impact memory management and application stability. Diagnosing deadlock requires analyzing resource locks and process states, while detecting memory leaks involves monitoring memory usage patterns and object lifecycles.
Common Scenarios Leading to Deadlock
Deadlock commonly occurs in multithreaded applications when two or more processes hold resources and wait indefinitely for each other to release them, often seen in database transactions and resource allocation in operating systems. Typical scenarios include circular wait conditions where threads acquire locks in inconsistent orders, and processes waiting for locks on files or semaphores held by each other. Understanding these common deadlock patterns is crucial for designing concurrent systems that avoid freezing and maintain optimal resource utilization.
Typical Causes of Memory Leaks in Applications
Typical causes of memory leaks in applications include improper deallocation of memory, such as failing to free dynamically allocated objects or neglecting to close connections and file handles. Retaining unnecessary references in data structures like lists or caches can prevent the garbage collector from reclaiming memory. Common programming errors, including circular references and unmanaged resource retention, often lead to gradual memory consumption growth and deteriorating application performance.
Detecting Deadlocks: Tools and Techniques
Detecting deadlocks involves analyzing thread states and resource locks using tools such as Java VisualVM, WinDbg, or thread dump analyzers, which highlight waiting and holding threads to pinpoint circular dependencies. Techniques include monitoring system logs, leveraging static code analyzers like FindBugs or SonarQube for potential deadlock patterns, and employing runtime monitors that trace lock acquisition order. Combining these methods improves accuracy in identifying deadlocks compared to memory leaks, which often require heap analyzers like Eclipse MAT or Valgrind for detecting unreleased memory blocks.
Identifying and Diagnosing Memory Leaks
Memory leaks can be identified by monitoring applications for continuously increasing memory usage despite stable workloads, often detected using profiling tools like Valgrind, VisualVM, or LeakSanitizer. Symptoms such as degraded performance, frequent garbage collection, and out-of-memory errors also indicate possible leaks. Diagnosing memory leaks involves analyzing heap dumps, tracking object references, and employing automated memory analyzers to pinpoint uncollected objects that should have been freed.
Best Practices to Prevent Deadlocks and Memory Leaks
Implement robust synchronization techniques such as fine-grained locking and lock hierarchy to prevent deadlocks, ensuring threads avoid circular wait conditions. Employ automatic memory management tools like garbage collectors and use smart pointers in C++ to mitigate memory leaks effectively. Regularly analyze code with static analyzers and runtime profilers to detect and resolve potential deadlocks and memory leaks, enhancing application stability and performance.
Conclusion: Ensuring Robust and Efficient Software
Deadlocks and memory leaks both critically undermine software performance and reliability, with deadlocks causing system freezes by halting process execution and memory leaks depleting available memory resources over time. Effective detection tools and proactive management strategies are essential to prevent these issues, ensuring optimal resource allocation and uninterrupted operation. Prioritizing concurrency control and memory management in development cycles leads to robust and efficient software systems.
Deadlock Infographic