The break-even point is the sales level at which total revenues equal total costs, resulting in neither profit nor loss. Understanding this metric is essential for making informed business decisions and setting realistic financial goals. Explore the rest of the article to learn how to calculate your break-even point and leverage it for business success.
Table of Comparison
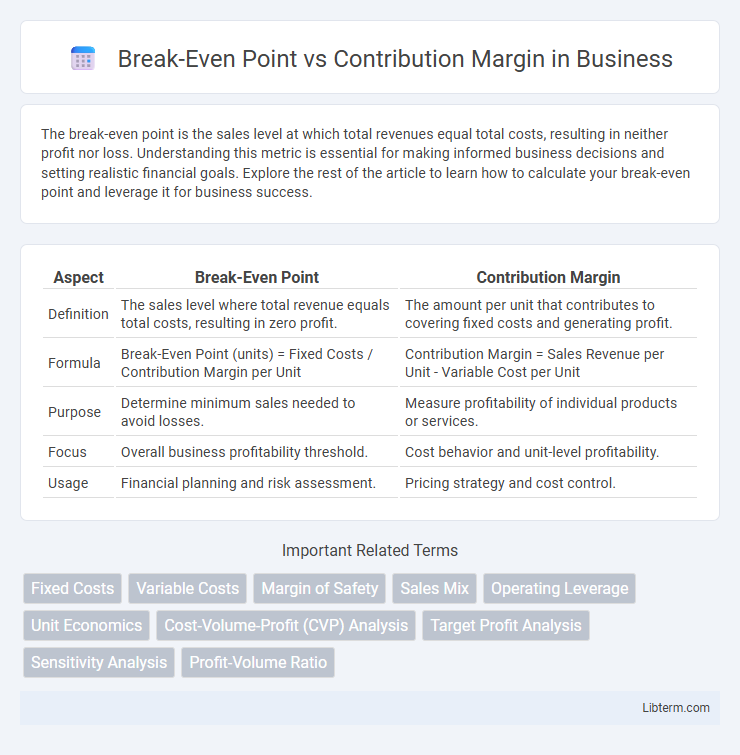
| Aspect | Break-Even Point | Contribution Margin |
|---|---|---|
| Definition | The sales level where total revenue equals total costs, resulting in zero profit. | The amount per unit that contributes to covering fixed costs and generating profit. |
| Formula | Break-Even Point (units) = Fixed Costs / Contribution Margin per Unit | Contribution Margin = Sales Revenue per Unit - Variable Cost per Unit |
| Purpose | Determine minimum sales needed to avoid losses. | Measure profitability of individual products or services. |
| Focus | Overall business profitability threshold. | Cost behavior and unit-level profitability. |
| Usage | Financial planning and risk assessment. | Pricing strategy and cost control. |
Introduction to Break-Even Point and Contribution Margin
The break-even point represents the sales level at which total revenues equal total costs, resulting in zero profit or loss. Contribution margin is the amount remaining from sales revenue after variable expenses are deducted, which contributes to covering fixed costs and generating profit. Understanding both metrics is essential for businesses to determine the minimum sales required to avoid losses and to analyze profitability drivers.
Defining the Break-Even Point
The break-even point represents the sales level at which total revenues equal total costs, resulting in neither profit nor loss. It is calculated by dividing fixed costs by the contribution margin per unit, where the contribution margin is the difference between sales price and variable cost per unit. Understanding the break-even point helps businesses determine the minimum sales volume needed to cover expenses and start generating profit.
Understanding Contribution Margin
Contribution Margin represents the amount remaining from sales revenue after variable expenses are deducted, serving as a critical indicator of a company's profitability per unit sold. It directly influences the Break-Even Point by determining how much revenue contributes to covering fixed costs before generating profit. A higher Contribution Margin lowers the Break-Even Point, enabling faster achievement of profitability and providing essential insights for pricing and cost control strategies.
Key Differences Between Break-Even Point and Contribution Margin
The break-even point represents the sales volume at which total revenues equal total costs, resulting in zero profit or loss, while contribution margin indicates the amount per unit sale that contributes to covering fixed costs and generating profit. The break-even point is expressed in units or sales dollars, whereas contribution margin is calculated per unit or as a ratio to sales revenue. Understanding these distinctions aids businesses in pricing strategies, cost control, and profitability analysis.
Importance in Financial Decision-Making
The break-even point determines the level of sales needed to cover total costs, serving as a critical benchmark for financial planning and risk assessment. Contribution margin measures the profitability per unit, guiding decisions on pricing, product mix, and cost control to enhance profit margins. Together, these metrics enable businesses to make informed financial decisions by balancing costs, pricing strategies, and sales targets for sustainable growth.
Step-by-Step Calculation Methods
Determining the Break-Even Point involves dividing fixed costs by the contribution margin per unit, where the contribution margin equals sales revenue minus variable costs. First, calculate the contribution margin per unit by subtracting variable costs from sales price; then, use this figure to compute the break-even sales volume by dividing total fixed costs by the contribution margin per unit. This step-by-step method enables precise financial planning by identifying the minimum sales required to cover all fixed and variable expenses.
Real-World Examples and Applications
The break-even point identifies the sales volume at which total revenues equal total costs, essential for businesses to avoid losses, while the contribution margin represents the per-unit profit contributing to fixed costs and profit after variable costs are covered. In retail, a clothing store uses break-even analysis to determine the number of garments sold monthly to cover fixed expenses such as rent and salaries, while the contribution margin helps price products by highlighting profitability per item. Manufacturing firms apply contribution margin analysis to select product lines with the highest margins, ensuring efficient resource allocation and achieving break-even targets faster under varying production scales.
Common Mistakes and Misconceptions
Many businesses confuse the break-even point with contribution margin, mistakenly treating them interchangeably despite their distinct roles; the break-even point represents the sales volume needed to cover total costs, while contribution margin indicates the profit per unit after variable costs. Common errors include ignoring fixed costs when calculating contribution margin or inaccurately estimating break-even volume by neglecting fluctuations in variable expenses. Misconceptions often arise from assuming contribution margin alone ensures profitability, without considering fixed cost recovery encapsulated by the break-even analysis.
Tools and Techniques for Accurate Analysis
Tools and techniques for accurate analysis of break-even point versus contribution margin include financial modeling software, cost-volume-profit (CVP) analysis, and spreadsheet calculators. These instruments enable precise calculation of fixed costs, variable costs, and contribution margins to determine the break-even sales volume. Sensitivity analysis and scenario planning further refine decision-making by assessing how changes in costs or prices impact profitability and break-even thresholds.
Conclusion: Which Metric Matters Most?
The break-even point determines the minimum sales volume needed to cover fixed and variable costs, while the contribution margin reveals the profitability per unit sold. Contribution margin is crucial for pricing strategies and maximizing profit per unit, but the break-even point offers essential insight into when a business becomes profitable. Focusing on contribution margin allows more dynamic decision-making, yet understanding the break-even point remains vital for financial stability and risk assessment.
Break-Even Point Infographic