Indifference curves represent combinations of two goods that provide the same level of satisfaction to a consumer, illustrating consumer preferences and trade-offs. These curves are convex to the origin, reflecting the diminishing marginal rate of substitution between goods as consumption changes. Explore the rest of the article to understand how indifference curves model consumer behavior and decision-making.
Table of Comparison
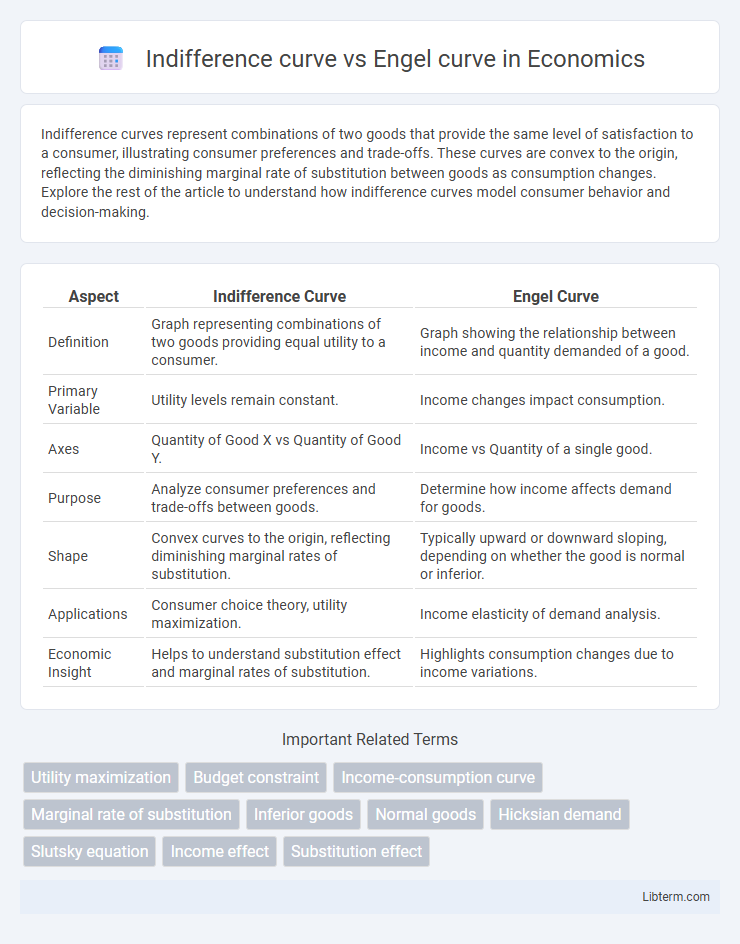
| Aspect | Indifference Curve | Engel Curve |
|---|---|---|
| Definition | Graph representing combinations of two goods providing equal utility to a consumer. | Graph showing the relationship between income and quantity demanded of a good. |
| Primary Variable | Utility levels remain constant. | Income changes impact consumption. |
| Axes | Quantity of Good X vs Quantity of Good Y. | Income vs Quantity of a single good. |
| Purpose | Analyze consumer preferences and trade-offs between goods. | Determine how income affects demand for goods. |
| Shape | Convex curves to the origin, reflecting diminishing marginal rates of substitution. | Typically upward or downward sloping, depending on whether the good is normal or inferior. |
| Applications | Consumer choice theory, utility maximization. | Income elasticity of demand analysis. |
| Economic Insight | Helps to understand substitution effect and marginal rates of substitution. | Highlights consumption changes due to income variations. |
Introduction to Indifference Curve and Engel Curve
Indifference curves represent combinations of two goods that provide a consumer with equal satisfaction, illustrating preferences and trade-offs in consumer choice theory. Engel curves depict the relationship between a consumer's income and the quantity demanded of a particular good, showing how consumption changes as income varies. Together, these curves help analyze consumer behavior, with indifference curves focusing on preferences and Engel curves emphasizing income effects on demand.
Definition of Indifference Curve
An indifference curve represents a graphical depiction of different combinations of two goods that provide a consumer with the same level of satisfaction or utility, illustrating consumer preferences without explicit consideration of income or prices. Unlike the Engel curve, which shows the relationship between income and quantity demanded for a single good, the indifference curve focuses on consumer choices under given preferences. This curve is downward sloping and convex to the origin, reflecting diminishing marginal rates of substitution between goods.
Definition of Engel Curve
An Engel curve illustrates the relationship between consumer income and the quantity demanded of a good, showing how consumption changes as income varies. Unlike the indifference curve, which represents combinations of goods providing equal utility, the Engel curve specifically maps income effects on demand for a single good. This curve is essential in consumer behavior analysis and income elasticity measurement.
Core Assumptions of Both Curves
Indifference curves assume consumer preferences are complete, transitive, and non-satiated, reflecting combinations of goods that provide equal utility. Engel curves are based on the assumption that income changes influence the quantity demanded of a good, holding preferences constant. Both curves rely on rational consumer behavior, but indifference curves emphasize utility maximization while Engel curves highlight income-consumption relationships.
Mathematical Representation
The indifference curve can be mathematically represented as U(x, y) = k, where U denotes the utility function, and k is a constant utility level indicating combinations of goods x and y providing equal satisfaction. The Engel curve is expressed as x = f(I, px), showing the relationship between the quantity demanded of good x and consumer income I, with px symbolizing the price of good x; it illustrates how consumption varies with income at constant prices. Both curves are fundamental in consumer theory, modeling preferences and income effects, but the indifference curve focuses on utility constancy, while the Engel curve captures income-consumption behavior.
Graphical Comparison: Indifference vs Engel Curve
The indifference curve graphically represents combinations of two goods that yield the same utility level, typically illustrated as convex to the origin reflecting consumer preferences and marginal rates of substitution. The Engel curve, by contrast, plots the relationship between a consumer's income and the quantity demanded of a single good, capturing how consumption changes with income variations. While the indifference curve is mapped in a two-good space emphasizing substitution effects, the Engel curve is a single-good income-consumption graph highlighting income effects on demand.
Interpretation of Consumer Preferences
Indifference curves represent combinations of goods that provide a consumer with equal satisfaction, illustrating preferences without considering income or price changes. Engel curves depict the relationship between income levels and quantity demanded of a good, revealing how consumption varies with income. Together, these curves interpret consumer preferences by showing both relative satisfaction from trade-offs and income effects on purchasing decisions.
Income Effect on Both Curves
The Indifference curve illustrates consumer preferences and how varying income levels alter consumption bundles without a price change, highlighting the income effect through shifts to higher or lower curves. The Engel curve specifically quantifies the relationship between income and quantity demanded of a good, directly capturing the income effect as consumption changes with income variations. Both curves emphasize the income effect but from distinct perspectives: Indifference curves focus on utility maximization under budget constraints, while Engel curves depict consumption patterns relative to income.
Applications in Consumer Theory
Indifference curves illustrate consumer preferences by showing combinations of goods that yield equal satisfaction, essential for analyzing utility maximization and substitution effects. Engel curves depict the relationship between consumer income and quantity demanded for a good, pivotal in studying income effects and expenditure patterns. Together, these curves enable economists to model consumer choice, budget constraints, and demand responses to price and income changes in consumer theory.
Key Differences Between Indifference and Engel Curves
Indifference curves represent combinations of goods providing equal satisfaction or utility to a consumer, illustrating consumer preferences and substitution effects, while Engel curves show the relationship between income levels and consumption quantities of a specific good, highlighting income effects. Indifference curves are derived from utility maximization subject to budget constraints, whereas Engel curves plot income changes against quantity demanded for a given price. The key difference lies in the focus: indifference curves analyze preferences between goods, and Engel curves track how consumption varies with income changes.
Indifference curve Infographic