The demand curve illustrates the relationship between the price of a good and the quantity consumers are willing to purchase at each price level. It typically slopes downward, reflecting the law of demand where lower prices lead to higher demand. Explore the rest of the article to understand how shifts in the demand curve impact markets and consumer behavior.
Table of Comparison
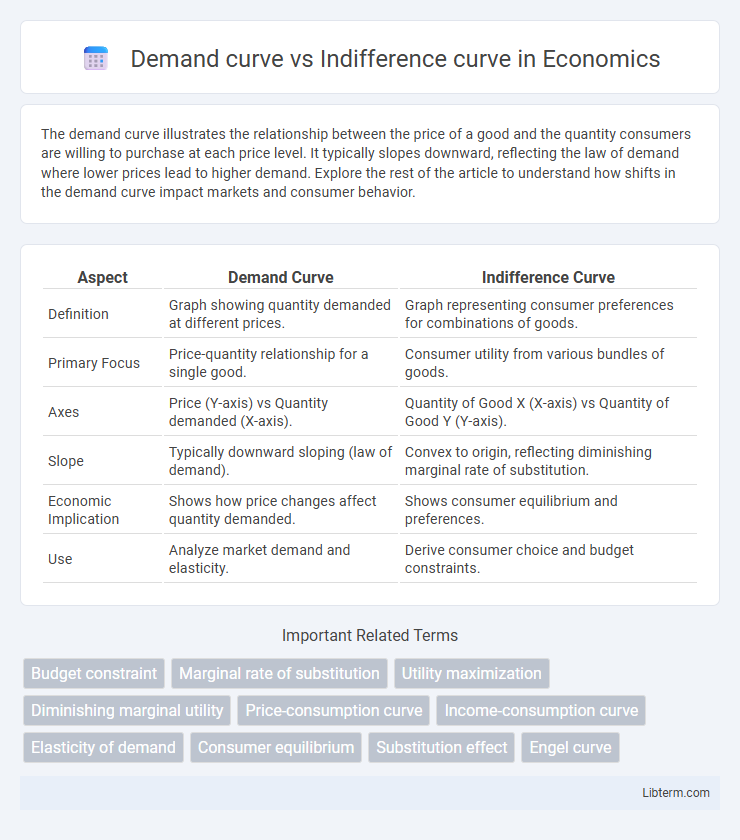
| Aspect | Demand Curve | Indifference Curve |
|---|---|---|
| Definition | Graph showing quantity demanded at different prices. | Graph representing consumer preferences for combinations of goods. |
| Primary Focus | Price-quantity relationship for a single good. | Consumer utility from various bundles of goods. |
| Axes | Price (Y-axis) vs Quantity demanded (X-axis). | Quantity of Good X (X-axis) vs Quantity of Good Y (Y-axis). |
| Slope | Typically downward sloping (law of demand). | Convex to origin, reflecting diminishing marginal rate of substitution. |
| Economic Implication | Shows how price changes affect quantity demanded. | Shows consumer equilibrium and preferences. |
| Use | Analyze market demand and elasticity. | Derive consumer choice and budget constraints. |
Introduction to Demand Curve and Indifference Curve
The demand curve illustrates the relationship between the price of a good and the quantity demanded by consumers, reflecting how price changes influence purchasing behavior. The indifference curve represents combinations of two goods that provide the consumer with equal levels of satisfaction or utility, highlighting preferences rather than price effects. Together, these curves help analyze consumer choice by connecting utility maximization with market demand patterns.
Defining the Demand Curve
The demand curve represents the relationship between the price of a good and the quantity demanded by consumers, illustrating how demand varies inversely with price. It is derived from individual preferences and income constraints, reflecting consumers' willingness to purchase different quantities at various prices. Unlike the indifference curve, which shows combinations of goods providing equal satisfaction, the demand curve directly quantifies purchasing behavior in response to price changes.
Defining the Indifference Curve
The indifference curve represents a graphical depiction of consumer preferences, showing combinations of two goods between which a consumer is indifferent, meaning they derive equal utility from each combination. Unlike the demand curve, which illustrates the relationship between price and quantity demanded, the indifference curve focuses on consumer satisfaction levels without directly considering price. It is convex to the origin, reflecting the diminishing marginal rate of substitution as consumers trade one good for another.
Key Differences between Demand Curve and Indifference Curve
The demand curve represents the relationship between the price of a good and the quantity demanded by consumers, reflecting consumer purchasing behavior based on prices and income. The indifference curve illustrates combinations of two goods that provide the consumer with equal levels of satisfaction, emphasizing consumer preferences rather than prices. Key differences include the demand curve's focus on price-quantity dynamics and market behavior, while the indifference curve centers on utility and subjective consumer choice without involving market prices.
Factors Influencing the Demand Curve
The demand curve is primarily influenced by factors such as consumer income, prices of related goods, consumer preferences, and expectations about future prices, which directly affect the quantity demanded at various price levels. In contrast, the indifference curve represents consumer preferences and shows combinations of goods providing equal satisfaction, unaffected by price changes or income variations. Understanding shifts in the demand curve requires analyzing variables including changes in consumer tastes, income levels, substitute and complementary goods prices, and population demographics.
Factors Affecting the Indifference Curve
The shape and position of an indifference curve are influenced by factors such as changes in consumer preferences, income levels, and the availability of substitute or complementary goods. Unlike the demand curve, which shifts due to price changes and income effects, indifference curves shift when a consumer's relative valuation of goods changes, altering the utility derived from combinations of goods. Understanding these determinants helps differentiate the consumer's choice behavior reflected in indifference curves from market demand patterns shown in demand curves.
Role in Consumer Choice Theory
The demand curve represents the relationship between the price of a good and the quantity demanded, illustrating consumer purchasing behavior at different price levels. The indifference curve reflects combinations of goods that provide the consumer with equal satisfaction or utility, capturing preferences without reference to price. Together, these curves underpin Consumer Choice Theory by linking consumer preferences (indifference curves) with market constraints and price signals (demand curve) to explain optimal consumption decisions.
Graphical Representation and Interpretation
The demand curve is a downward-sloping graph showing the relationship between price and quantity demanded, illustrating how consumers buy more at lower prices. In contrast, the indifference curve is convex to the origin, representing different combinations of two goods that provide equal utility or satisfaction to the consumer. Whereas the demand curve captures price-quantity dynamics, the indifference curve reflects consumer preferences and marginal rates of substitution without price considerations.
Practical Applications in Economics
Demand curves play a crucial role in determining market equilibrium by illustrating the relationship between price and quantity demanded, enabling businesses to optimize pricing strategies and forecast consumer behavior. Indifference curves assist in understanding consumer preferences by representing combinations of goods that yield equal satisfaction, aiding economists in analyzing substitution effects and budget constraints. Both tools are essential in practical economic applications such as welfare analysis, policy formulation, and market demand estimation, providing insights into consumer choice and market dynamics.
Conclusion: Comparing Demand and Indifference Curves
Demand curves represent the relationship between price and quantity demanded, reflecting consumer choices based on market prices, while indifference curves illustrate consumer preferences and combinations of goods yielding equal satisfaction, independent of prices. Demand curves slope downward due to the law of demand, whereas indifference curves are convex to the origin, showing diminishing marginal rates of substitution. Comparing both, demand curves capture actual purchasing behavior influenced by prices and income, while indifference curves reveal the underlying preference structure guiding those choices.
Demand curve Infographic