The Price-to-Earnings (P/E) ratio measures a company's current share price relative to its per-share earnings, serving as a key indicator of market expectations about future growth. Investors use this ratio to evaluate whether a stock is overvalued or undervalued compared to its earnings potential. Discover how understanding the P/E ratio can enhance your investment decisions by reading the rest of the article.
Table of Comparison
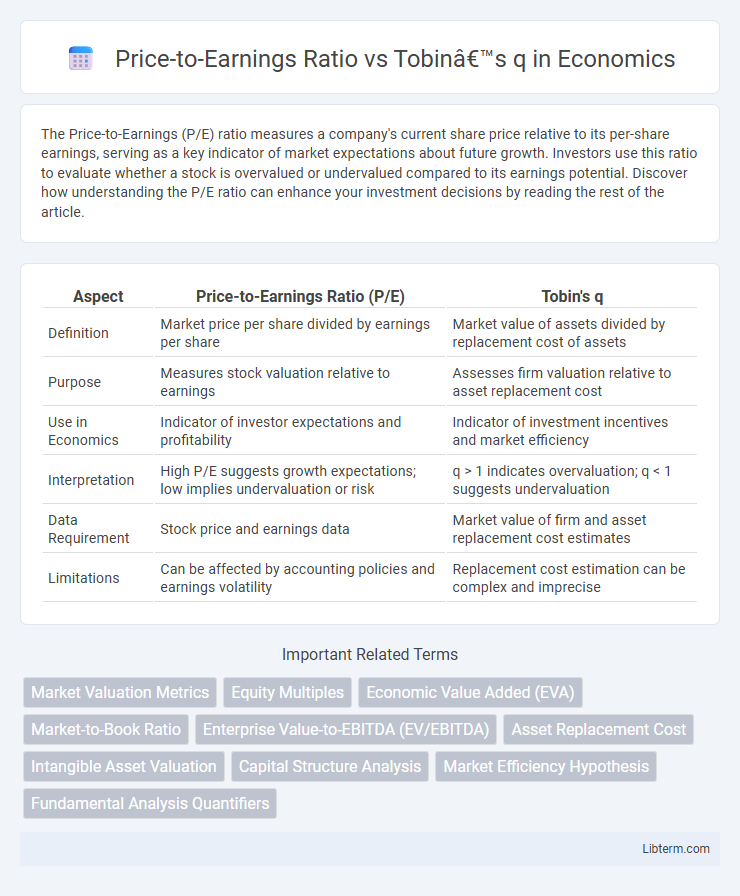
| Aspect | Price-to-Earnings Ratio (P/E) | Tobin's q |
|---|---|---|
| Definition | Market price per share divided by earnings per share | Market value of assets divided by replacement cost of assets |
| Purpose | Measures stock valuation relative to earnings | Assesses firm valuation relative to asset replacement cost |
| Use in Economics | Indicator of investor expectations and profitability | Indicator of investment incentives and market efficiency |
| Interpretation | High P/E suggests growth expectations; low implies undervaluation or risk | q > 1 indicates overvaluation; q < 1 suggests undervaluation |
| Data Requirement | Stock price and earnings data | Market value of firm and asset replacement cost estimates |
| Limitations | Can be affected by accounting policies and earnings volatility | Replacement cost estimation can be complex and imprecise |
Introduction to Financial Ratios
Price-to-Earnings (P/E) Ratio measures a company's current share price relative to its per-share earnings, providing insight into market expectations and valuation. Tobin's q compares the market value of a firm's assets to their replacement cost, reflecting investment attractiveness and potential over- or under-valuation. Both ratios serve as crucial financial metrics for investors to assess stock valuation and company performance within market contexts.
Understanding the Price-to-Earnings Ratio
The Price-to-Earnings (P/E) Ratio measures a company's current share price relative to its earnings per share, serving as a key indicator of market valuation and investor expectations. Unlike Tobin's q, which compares market value to asset replacement cost, the P/E Ratio focuses on profitability and future earnings potential. A high P/E Ratio often signals investor confidence in growth, while a low P/E may indicate undervaluation or earnings concerns.
What is Tobin’s q?
Tobin's q is a financial metric that compares the market value of a firm's assets to the replacement cost of those assets, offering insight into whether a company is undervalued or overvalued. Unlike the Price-to-Earnings (P/E) ratio, which measures stock price relative to earnings, Tobin's q assesses the overall valuation of a company's physical capital. A Tobin's q greater than one suggests that the market values the firm's assets more than their replacement cost, indicating potential growth opportunities or overvaluation.
Key Differences Between P/E Ratio and Tobin’s q
Price-to-Earnings (P/E) Ratio measures a company's current share price relative to its earnings per share, reflecting market expectations of future profitability. Tobin's q compares the market value of a firm's assets to their replacement cost, indicating whether an asset is overvalued or undervalued in the market. While P/E ratio emphasizes earnings performance and investor sentiment, Tobin's q focuses on asset valuation and investment efficiency, making them complementary metrics for financial analysis.
Calculation Methods: P/E vs Tobin’s q
The Price-to-Earnings (P/E) ratio is calculated by dividing the current market price per share by the earnings per share (EPS), reflecting market expectations of a company's future profitability. Tobin's q is computed by dividing the market value of a firm's assets by the replacement cost of those assets, providing insight into whether the firm is over or undervalued relative to its asset base. While P/E focuses on earnings and market perceptions, Tobin's q emphasizes asset valuation and investment decisions based on market versus replacement costs.
Use Cases in Equity Valuation
The Price-to-Earnings (P/E) ratio is widely used for equity valuation by comparing a company's current share price to its per-share earnings, providing insights into market expectations of future profitability and relative valuation across firms within the same industry. Tobin's q, which measures the market value of a firm relative to the replacement cost of its assets, offers a broader perspective by incorporating asset valuation and investment prospects, making it particularly useful for assessing capital-intensive industries. Both metrics serve distinct but complementary roles in equity valuation, with P/E ratio emphasizing earnings efficiency and Tobin's q highlighting market expectations around asset replacement and growth potential.
Advantages and Limitations of P/E Ratio
The Price-to-Earnings (P/E) ratio provides a straightforward measure of a company's market valuation relative to its earnings, facilitating quick comparisons across industries. Its advantages include simplicity, widespread availability, and ease of interpretation for investors assessing profitability and growth expectations. Limitations arise from its vulnerability to accounting distortions, earnings volatility, and the exclusion of asset replacement costs, which Tobin's q addresses by incorporating market value relative to asset replacement cost for a comprehensive valuation perspective.
Strengths and Weaknesses of Tobin’s q
Tobin's q measures a firm's market value relative to its asset replacement cost, providing insight into investment opportunities and market overvaluation or undervaluation. It captures the market's assessment of growth prospects better than the Price-to-Earnings (P/E) ratio, which only reflects current earnings relative to price. However, Tobin's q can be unreliable due to difficulties in accurately valuing replacement costs and accounting for intangible assets, limiting its effectiveness in industries with significant intellectual property.
Interpreting Market Signals with Both Ratios
Price-to-Earnings (P/E) ratio measures a company's current share price relative to its per-share earnings, indicating market expectations about future growth and profitability. Tobin's q compares a firm's market value to the replacement cost of its assets, signaling whether the market values the company above or below the cost of its capital. Analyzing both ratios together provides a comprehensive view of market signals by highlighting investor sentiment on earnings potential through P/E and asset valuation efficiency through Tobin's q.
Conclusion: Choosing the Right Ratio for Analysis
Price-to-Earnings Ratio offers immediate insights into market valuation relative to earnings, making it ideal for short-term investment decisions focusing on profitability. Tobin's q provides a broader perspective by comparing market value with asset replacement costs, useful for long-term strategic analysis and assessing market efficiency. Selecting the appropriate ratio depends on the investment horizon and analytical goal, with P/E favoring earnings-driven valuation and Tobin's q catering to asset-based market assessments.
Price-to-Earnings Ratio Infographic