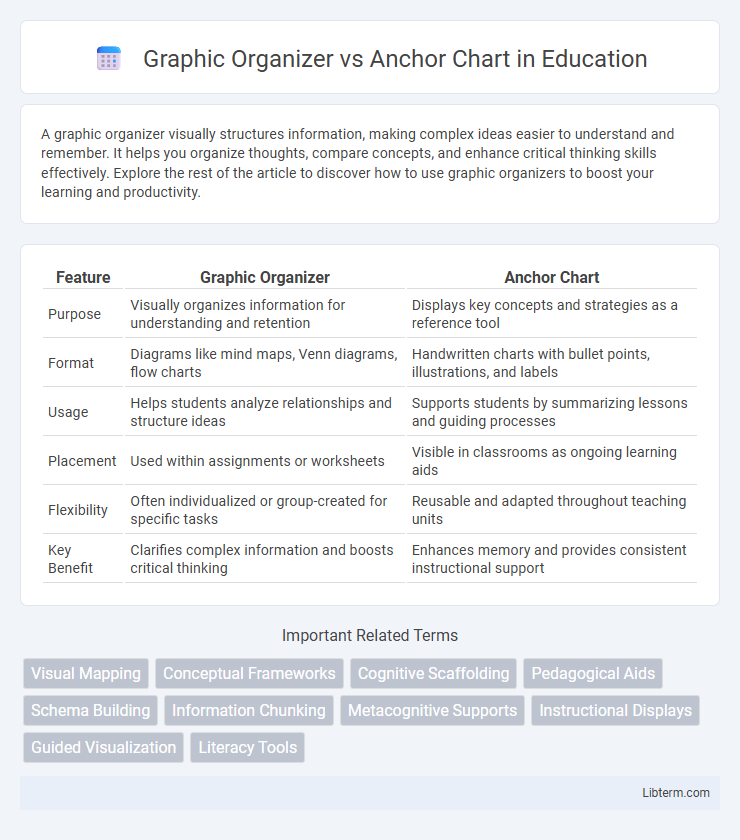
A graphic organizer visually structures information, making complex ideas easier to understand and remember. It helps you organize thoughts, compare concepts, and enhance critical thinking skills effectively. Explore the rest of the article to discover how to use graphic organizers to boost your learning and productivity.
Table of Comparison
| Feature | Graphic Organizer | Anchor Chart |
|---|---|---|
| Purpose | Visually organizes information for understanding and retention | Displays key concepts and strategies as a reference tool |
| Format | Diagrams like mind maps, Venn diagrams, flow charts | Handwritten charts with bullet points, illustrations, and labels |
| Usage | Helps students analyze relationships and structure ideas | Supports students by summarizing lessons and guiding processes |
| Placement | Used within assignments or worksheets | Visible in classrooms as ongoing learning aids |
| Flexibility | Often individualized or group-created for specific tasks | Reusable and adapted throughout teaching units |
| Key Benefit | Clarifies complex information and boosts critical thinking | Enhances memory and provides consistent instructional support |
Introduction to Graphic Organizers and Anchor Charts
Graphic organizers visually represent information to enhance comprehension, organization, and analysis of complex ideas across subjects like reading, writing, and science. Anchor charts serve as reference tools created during lessons that capture key concepts, strategies, and processes to support student learning and retention. Both tools promote active engagement, but graphic organizers emphasize structured data relationships while anchor charts highlight ongoing classroom dialogue and reminders.
Defining Graphic Organizers
Graphic organizers are visual tools used to structure information, helping learners categorize and connect ideas clearly. They include diagrams like mind maps, Venn diagrams, and flowcharts that facilitate comprehension and memory retention. Unlike anchor charts, graphic organizers primarily serve as interactive aids for brainstorming and problem-solving during lessons.
What Are Anchor Charts?
Anchor charts are visual tools used in classrooms to support student learning by displaying key concepts, strategies, and processes. They are collaboratively created during lessons, serving as ongoing references that reinforce and organize essential information. Unlike graphic organizers, which structure information for individual use, anchor charts promote collective understanding and engagement by highlighting critical content.
Key Differences Between Graphic Organizers and Anchor Charts
Graphic organizers visually structure information to support comprehension and organization of ideas, often using diagrams like Venn diagrams, flow charts, or mind maps. Anchor charts serve as instructional tools displayed in classrooms, summarizing lessons, strategies, or processes to reinforce learning and provide ongoing reference. While graphic organizers facilitate active student engagement during tasks, anchor charts primarily function as static visual reminders created collaboratively or by teachers to support retention and recall.
Visual Learning: Benefits of Graphic Organizers
Graphic organizers enhance visual learning by structuring information into clear, manageable segments, aiding comprehension and retention. Unlike anchor charts, which summarize key concepts for reference, graphic organizers actively engage students in organizing data, promoting critical thinking and deeper understanding. Their visual format supports diverse learning styles, making complex information more accessible and facilitating improved academic performance.
Collaborative Advantages of Anchor Charts
Anchor charts foster collaborative learning by encouraging active student participation in their creation, which enhances comprehension and retention of information. They serve as visual references that evolve through group input, supporting diverse learning styles and promoting shared responsibility. This dynamic interaction builds a sense of community and improves critical thinking by allowing students to contribute ideas and clarify concepts collectively.
When to Use Graphic Organizers in the Classroom
Graphic organizers are most effective in classrooms when students need to visually structure information, such as during brainstorming sessions, comparing and contrasting concepts, or analyzing cause and effect relationships. These tools facilitate comprehension and retention by breaking down complex ideas into manageable parts, ideal for subjects like reading comprehension, science experiments, and essay planning. Teachers can use graphic organizers to support diverse learning styles, enhance critical thinking, and guide students through multi-step problem-solving processes.
Best Scenarios for Implementing Anchor Charts
Anchor charts are most effective in classroom settings where ongoing reference and visual reinforcement enhance student understanding and retention. They work best during interactive lessons that require students to collaboratively build and revisit key concepts, strategies, or processes. Implementing anchor charts in scenarios involving complex skills, such as writing frameworks or problem-solving steps, offers a tangible resource that supports gradual learning and independent practice.
Integrating Both Tools for Enhanced Learning
Integrating graphic organizers and anchor charts enhances learning by combining structured information mapping with visual reference points, fostering better comprehension and retention. Graphic organizers allow students to organize and categorize complex information, while anchor charts provide ongoing visual reminders of key concepts and strategies. Using both tools together supports diverse learning styles and promotes active engagement, deepening students' understanding and critical thinking skills.
Conclusion: Choosing the Right Visual Aid
Choosing the right visual aid depends on the learning objective: graphic organizers excel in structuring information and promoting critical thinking, while anchor charts support ongoing reference and reinforcement of concepts. Educators should consider student needs and content complexity to maximize engagement and comprehension. Integrating both tools strategically enhances instructional effectiveness and supports diverse learning styles.
Graphic Organizer Infographic

 libterm.com