A T-Chart is a simple graphic organizer used to compare and contrast two ideas, concepts, or items side by side for easy analysis. It helps in organizing your thoughts clearly by dividing information into two columns, making it a valuable tool for decision-making and learning. Explore the article to discover how a T-Chart can enhance your understanding and productivity.
Table of Comparison
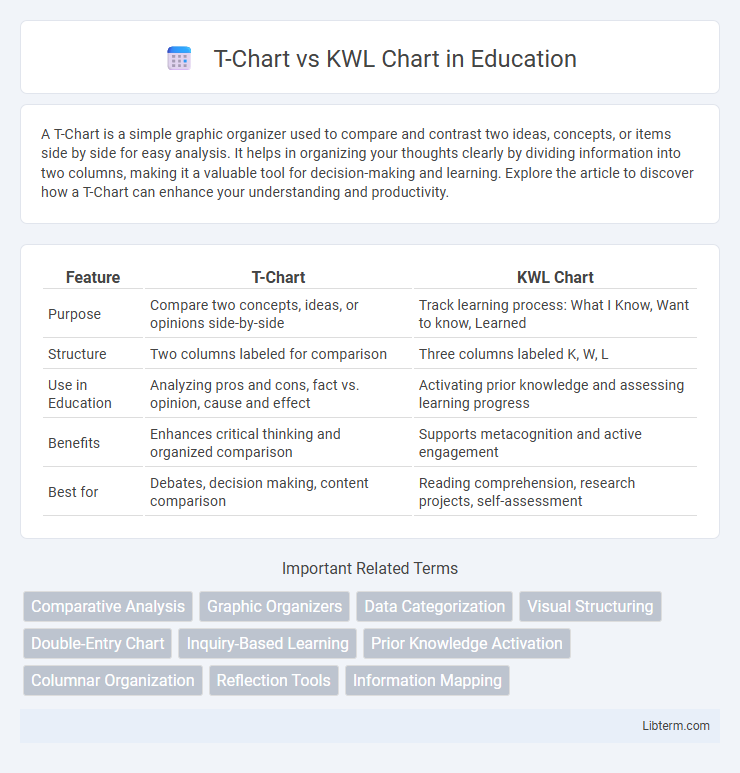
| Feature | T-Chart | KWL Chart |
|---|---|---|
| Purpose | Compare two concepts, ideas, or opinions side-by-side | Track learning process: What I Know, Want to know, Learned |
| Structure | Two columns labeled for comparison | Three columns labeled K, W, L |
| Use in Education | Analyzing pros and cons, fact vs. opinion, cause and effect | Activating prior knowledge and assessing learning progress |
| Benefits | Enhances critical thinking and organized comparison | Supports metacognition and active engagement |
| Best for | Debates, decision making, content comparison | Reading comprehension, research projects, self-assessment |
Introduction to Graphic Organizers
Graphic organizers like T-Charts and KWL Charts are essential tools for structuring information visually. A T-Chart divides data into two columns, ideal for comparing and contrasting concepts, while a KWL Chart guides learners through what they Know, Want to know, and have Learned, enhancing active reading and critical thinking. Both promote comprehension and organization skills by breaking down complex information into manageable segments.
What is a T-Chart?
A T-Chart is a graphic organizer used to compare two aspects of a topic, typically dividing information into two columns for easy visualization and analysis. It helps students or professionals organize pros and cons, facts and opinions, or causes and effects, enhancing critical thinking and decision-making skills. This tool is particularly effective in brainstorming sessions and evaluating contrasting ideas side by side.
What is a KWL Chart?
A KWL Chart is an educational graphic organizer that helps students track their learning by dividing information into three columns: What they Know, what they Want to know, and what they have Learned. This interactive tool promotes active engagement and helps assess prior knowledge while guiding research and reflection. Unlike a T-Chart, which simply compares two aspects, the KWL Chart supports a structured learning process and comprehension monitoring.
Key Features of T-Charts
T-Charts organize information into two distinct columns, making them ideal for comparing and contrasting concepts, ideas, or pros and cons clearly. They emphasize simplicity and clarity, allowing users to list characteristics, advantages, or disadvantages side by side without overlapping details. This visual structure supports decision-making and analytical thinking by highlighting differences or similarities directly.
Key Features of KWL Charts
KWL charts organize information into three columns: What I Know, What I Want to Know, and What I Learned, enabling structured learning and reflection. These charts promote active engagement by prompting users to identify prior knowledge, set learning objectives, and summarize new information effectively. KWL charts are widely used in educational settings for improving comprehension and guiding research or inquiry-based learning.
Comparing T-Chart and KWL Chart Structures
T-Charts present information in two distinct columns, typically used for comparing pros and cons, facts and opinions, or cause and effect, providing a clear and concise visual contrast. KWL Charts organize knowledge into three columns labeled "Know," "Want to know," and "Learned," facilitating active learning by tracking prior knowledge, questions, and new information gained. The structural difference lies in T-Charts emphasizing straightforward comparison, while KWL Charts support a dynamic learning process through inquiry and reflection.
Use Cases for T-Charts
T-Charts are ideal for comparing two contrasting concepts, such as pros and cons or cause and effect, providing a clear visual structure that enhances critical thinking and decision-making. Educators often use T-Charts to organize students' thoughts during debates or to analyze character traits in literature. In business, T-Charts facilitate weighing options in strategic planning or problem-solving by clearly delineating advantages and disadvantages.
Use Cases for KWL Charts
KWL charts excel in educational settings to activate prior knowledge, guide research, and assess learning by categorizing what students Know, Want to know, and have Learned. These charts are particularly effective in project-based learning, reading comprehension activities, and collaborative classroom discussions where tracking inquiry and knowledge acquisition enhances engagement. In contrast, T-Charts primarily facilitate comparison and decision-making by listing pros and cons or contrasting ideas side-by-side.
Pros and Cons: T-Chart vs KWL Chart
T-Charts facilitate clear comparison by organizing pros and cons side-by-side, making them ideal for decision-making and analytical tasks but may lack depth in exploring prior knowledge or learning objectives. KWL Charts excel in activating prior knowledge and setting learning goals while tracking what has been learned, enhancing comprehension and reflection, but they can be less effective for straightforward comparative analysis. Choosing between T-Charts and KWL Charts depends on whether the focus is on evaluation and decision-making (T-Chart) or on guided learning and knowledge-building (KWL Chart).
Choosing the Right Chart for Your Needs
Selecting between a T-Chart and a KWL Chart depends on your learning objectives and data analysis needs; T-Charts excel at comparing two aspects or pros and cons, providing a clear, side-by-side visual contrast. KWL Charts are ideal for tracking knowledge acquisition by outlining what students Know, Want to know, and have Learned, enhancing comprehension and engagement during lessons. Educators and analysts should evaluate whether their goal is comparative analysis or progressive learning assessment to choose the most effective chart type.
T-Chart Infographic