Flowcharts visually represent processes using symbols and arrows to simplify complex workflows, making it easier to identify each step and decision point. This method enhances clarity and communication across teams by providing a universal language for process mapping. Explore the rest of the article to learn how flowcharts can improve your project management and problem-solving skills.
Table of Comparison
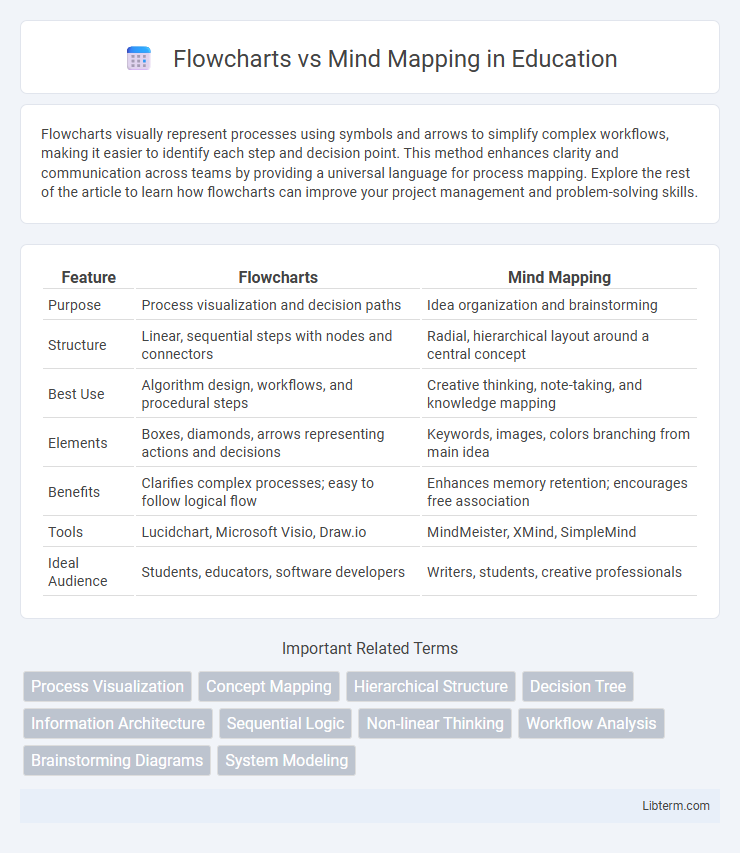
| Feature | Flowcharts | Mind Mapping |
|---|---|---|
| Purpose | Process visualization and decision paths | Idea organization and brainstorming |
| Structure | Linear, sequential steps with nodes and connectors | Radial, hierarchical layout around a central concept |
| Best Use | Algorithm design, workflows, and procedural steps | Creative thinking, note-taking, and knowledge mapping |
| Elements | Boxes, diamonds, arrows representing actions and decisions | Keywords, images, colors branching from main idea |
| Benefits | Clarifies complex processes; easy to follow logical flow | Enhances memory retention; encourages free association |
| Tools | Lucidchart, Microsoft Visio, Draw.io | MindMeister, XMind, SimpleMind |
| Ideal Audience | Students, educators, software developers | Writers, students, creative professionals |
Introduction to Flowcharts and Mind Mapping
Flowcharts visually represent processes using symbols like arrows, rectangles, and diamonds to illustrate sequential steps and decision points, making complex workflows easier to understand. Mind mapping organizes ideas around a central concept, using branches to capture related themes and foster creative brainstorming and problem-solving. Both tools enhance clarity and efficiency in planning, but flowcharts emphasize logical flow, while mind maps prioritize idea generation and organization.
Core Differences Between Flowcharts and Mind Mapping
Flowcharts visually represent sequential processes or workflows using standardized symbols like arrows, rectangles, and diamonds to depict decisions and steps. Mind mapping organizes ideas hierarchically around a central concept, emphasizing relationships and creative thinking through branches and keywords. The core difference lies in flowcharts' linear, process-oriented approach versus mind mapping's radial, idea-centric structure.
Visual Structure: Linear vs Non-Linear Approaches
Flowcharts emphasize a linear visual structure, using sequential shapes and arrows that guide users through a step-by-step process or decision-making path. Mind mapping employs a non-linear, radial layout, featuring a central concept with branches spreading outward to represent relationships and hierarchical connections. This fundamental difference in visual organization makes flowcharts ideal for procedural clarity, while mind maps excel at brainstorming and exploring complex ideas.
Use Cases: When to Use Flowcharts
Flowcharts excel in illustrating step-by-step processes, making them ideal for workflow analysis, algorithm design, and decision-making sequences. They provide clear visualization of procedural logic in business operations, software development, and project management. Use flowcharts when clarity in process flow and task dependencies is crucial for problem-solving or communication.
Use Cases: When to Use Mind Mapping
Mind mapping is ideal for brainstorming sessions, creative problem-solving, and organizing complex ideas visually to enhance memory and understanding. It excels in project planning, note-taking, and exploring hierarchical relationships between concepts. Use mind maps when the goal is to stimulate idea generation and capture nonlinear thoughts.
Benefits of Flowcharts for Process Analysis
Flowcharts provide a clear visual representation of sequential steps, making complex processes easier to understand and analyze. They help identify bottlenecks, redundancies, and decision points, facilitating process optimization. By offering a straightforward structure, flowcharts support effective communication and collaboration among teams during process analysis.
Advantages of Mind Mapping for Creativity
Mind mapping enhances creativity by visually organizing ideas, allowing flexible connections and promoting nonlinear thinking, which stimulates innovative problem-solving. This method encourages free association and rapid idea generation, making it easier to explore complex concepts and discover new perspectives. Unlike the structured and sequential flowcharts, mind maps provide a dynamic framework that fosters brainstorming and creative collaboration.
Flowcharts vs Mind Mapping in Team Collaboration
Flowcharts provide a clear, linear visualization of processes that help teams identify task sequences and decision points, enhancing coordination and reducing misunderstandings. Mind mapping fosters creative brainstorming by allowing team members to visually organize ideas and explore relationships, promoting collaborative problem-solving and innovation. Combining flowcharts with mind mapping in team collaboration ensures structured execution while maintaining flexibility for idea generation and strategic planning.
Tools and Software for Creating Flowcharts and Mind Maps
Flowcharts are effectively created using tools like Microsoft Visio, Lucidchart, and SmartDraw, which offer extensive shape libraries and automation features for process visualization. Mind mapping software such as MindMeister, XMind, and FreeMind emphasize intuitive node creation and easy idea organization with features like drag-and-drop and collaborative editing. Both categories of tools often support cloud integration, real-time collaboration, and export options, enhancing workflow efficiency and seamless sharing across teams.
Choosing the Right Method for Your Needs
Flowcharts excel in visualizing sequential processes with clear decision points, making them ideal for project planning, programming, and workflow analysis. Mind mapping supports creative brainstorming and information organization by visually connecting ideas around a central concept, enhancing memory retention and idea generation. Selecting between flowcharts and mind maps depends on whether you need structured process clarity or freeform idea exploration.
Flowcharts Infographic