An isochoric line represents a path on a thermodynamic diagram where the volume remains constant while other variables, such as pressure and temperature, may change. Understanding the behavior along an isochoric line is crucial for analyzing processes like heating in a rigid container or certain stages in thermodynamic cycles. Explore the rest of this article to grasp how isochoric processes impact physical systems and applications.
Table of Comparison
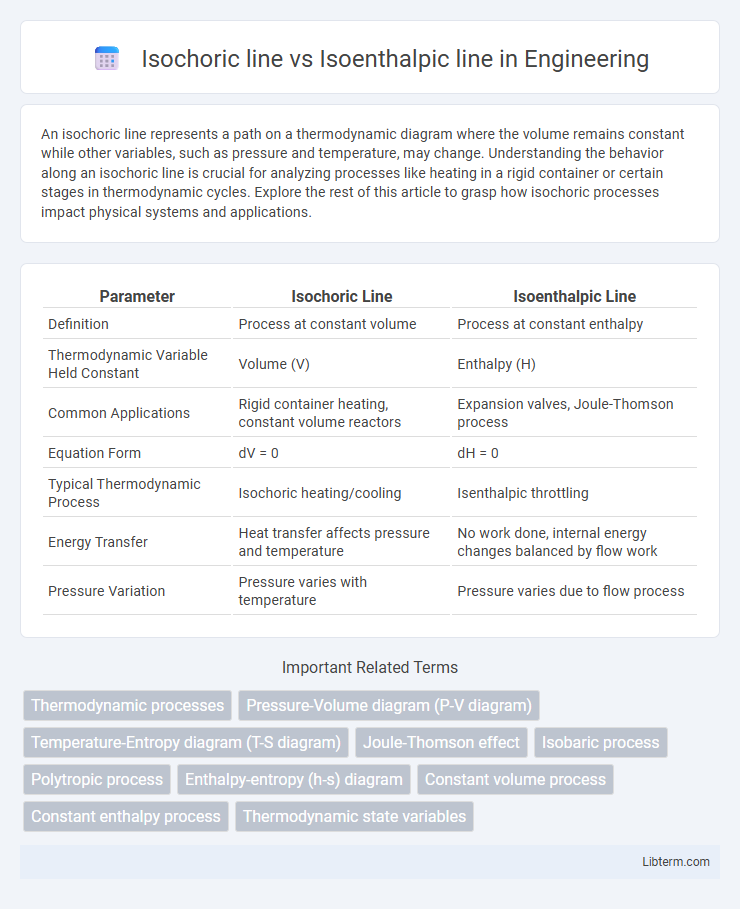
| Parameter | Isochoric Line | Isoenthalpic Line |
|---|---|---|
| Definition | Process at constant volume | Process at constant enthalpy |
| Thermodynamic Variable Held Constant | Volume (V) | Enthalpy (H) |
| Common Applications | Rigid container heating, constant volume reactors | Expansion valves, Joule-Thomson process |
| Equation Form | dV = 0 | dH = 0 |
| Typical Thermodynamic Process | Isochoric heating/cooling | Isenthalpic throttling |
| Energy Transfer | Heat transfer affects pressure and temperature | No work done, internal energy changes balanced by flow work |
| Pressure Variation | Pressure varies with temperature | Pressure varies due to flow process |
Understanding Isochoric and Isoenthalpic Processes
Isochoric processes occur at constant volume, meaning no work is done as the volume remains fixed, leading to changes in pressure and temperature with heat transfer. Isoenthalpic processes occur at constant enthalpy, commonly seen in throttling or expansion valves, where enthalpy remains constant despite changes in pressure and temperature. Understanding these processes is essential in thermodynamics for analyzing energy transformations in closed and open systems such as engines, refrigeration, and fluid flow.
Defining the Isochoric Line
The isochoric line represents a thermodynamic path where the volume remains constant, meaning no change in volume occurs during the process. It is characterized by a fixed specific volume and is crucial in understanding processes in closed systems, such as heated rigid containers. Unlike the isenthalpic line, which maintains constant enthalpy, the isochoric line focuses strictly on volume constraints, making it essential for analyzing pressure and temperature changes at constant volume.
Defining the Isoenthalpic Line
The isoenthalpic line represents a curve on a thermodynamic diagram where the enthalpy remains constant during a process, which is crucial for analyzing throttling processes and flow through nozzles. Unlike the isochoric line that maintains constant volume, the isoenthalpic line offers insights into energy changes without heat transfer or work but with variable pressure and temperature. Understanding isoenthalpic lines is essential for engineers in designing efficient systems involving phase changes and fluid expansion.
Key Thermodynamic Properties
Isochoric lines represent processes at constant volume where pressure and temperature vary, directly relating to specific volume and internal energy changes. Isoenthalpic lines depict processes occurring at constant enthalpy, commonly used in throttling or Joule-Thomson expansion, highlighting changes in pressure and temperature without heat exchange. Key thermodynamic properties distinguishing the two include constant volume for isochoric processes and constant enthalpy for isenthalpic processes, affecting their respective pressure-temperature-volume relationships.
Mathematical Representation: Isochoric vs Isoenthalpic
The isochoric line represents a process at constant volume, mathematically expressed as V = constant, meaning dV = 0 in thermodynamic equations. In contrast, the isoenthalpic line represents a process at constant enthalpy, denoted by H = constant, with dH = 0 capturing energy conservation during the process. These fundamental differences reflect how volume and enthalpy are held fixed in their respective thermodynamic transformations, influencing pressure and temperature relationships distinctly.
Graphical Depiction on Thermodynamic Diagrams
The isochoric line represents processes at constant volume and appears as a vertical line on pressure-volume (P-v) diagrams, while the isoenthalpic line depicts processes at constant enthalpy, often shown as curved lines in temperature-entropy (T-s) or enthalpy-entropy (h-s) diagrams. Isochoric lines are critical in understanding volume constraint processes, maintaining constant specific volume, whereas isoenthalpic lines are essential for analyzing throttling or expansion processes where enthalpy remains unchanged. The graphical distinction allows engineers to identify phase changes and energy interactions by observing line orientation and curvature on thermodynamic charts.
Real-World Examples and Applications
The isochoric line, representing constant volume processes, is critical in rigid container scenarios such as gas cylinders where pressure changes at fixed volume impact safety design and performance analysis. Isoenthalpic lines, indicating constant enthalpy, are fundamental in throttling processes like gas expansion through valves in refrigeration and natural gas pipelines, where understanding enthalpy stability helps optimize energy efficiency and system control. Real-world applications of isochoric and isoenthalpic processes enable precise thermodynamic predictions essential for engineering tasks in HVAC, chemical reactors, and fluid transport systems.
Differences in Pressure, Temperature, and Energy
An isochoric line represents processes at constant volume where pressure varies with temperature changes, maintaining internal energy as a function of temperature alone. In contrast, an isoenthalpic line describes processes at constant enthalpy, commonly found in throttling operations, where pressure and temperature both drop but enthalpy remains constant. The key difference lies in the energy focus: isochoric processes conserve volume affecting internal energy, whereas isoenthalpic processes conserve enthalpy, affecting both pressure and temperature simultaneously.
Implications in Engineering and Industry
Isochoric lines represent processes at constant volume, critical for designing pressure vessels and reactors where volume constraints affect pressure and temperature relationships. Isoenthalpic lines describe processes at constant enthalpy, essential in throttling devices like valves and nozzles for energy balance without heat transfer or work, influencing refrigeration and gas expansion cycles. Understanding these lines allows engineers to optimize system performance, enhance safety, and improve efficiency in thermodynamic processes across power generation, HVAC, and chemical industries.
Summary: Choosing Between Isochoric and Isoenthalpic Analysis
Isochoric lines represent processes at constant volume, essential for analyzing systems where volume remains fixed, such as rigid containers, while isoenthalpic lines depict constant enthalpy processes vital in throttling and expansion valves in thermodynamics. Selecting isochoric analysis suits applications emphasizing pressure and temperature changes without volume variation, whereas isoenthalpic analysis is optimal for studying energy transformations in adiabatic throttling or Joule-Thomson effects. Understanding these distinctions enhances accurate modeling of thermodynamic cycles and improves system efficiency predictions in engineering applications.
Isochoric line Infographic