Isoclines are curves on a direction field where the slope of a differential equation remains constant, providing valuable insight into solution behavior without solving the equation explicitly. Understanding isoclines helps visualize and approximate solutions by identifying regions with similar slopes, aiding in the analysis of complex dynamic systems. Explore the rest of this article to deepen your understanding of isoclines and apply them effectively in your mathematical studies.
Table of Comparison
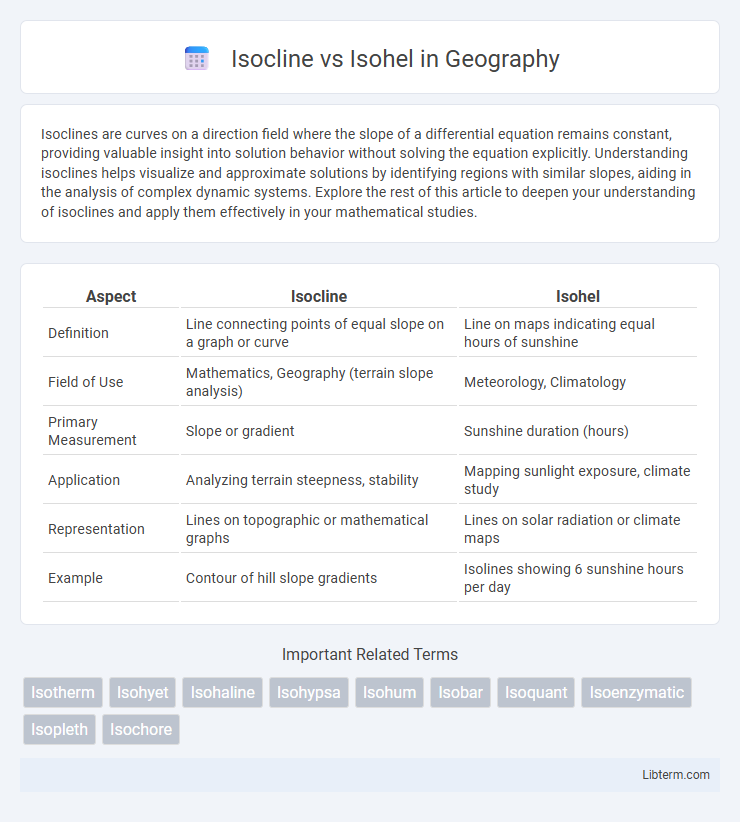
| Aspect | Isocline | Isohel |
|---|---|---|
| Definition | Line connecting points of equal slope on a graph or curve | Line on maps indicating equal hours of sunshine |
| Field of Use | Mathematics, Geography (terrain slope analysis) | Meteorology, Climatology |
| Primary Measurement | Slope or gradient | Sunshine duration (hours) |
| Application | Analyzing terrain steepness, stability | Mapping sunlight exposure, climate study |
| Representation | Lines on topographic or mathematical graphs | Lines on solar radiation or climate maps |
| Example | Contour of hill slope gradients | Isolines showing 6 sunshine hours per day |
Introduction to Isocline and Isohel
Isoclines are lines on a graph or map representing points where a differential equation has the same slope, crucial for analyzing solution curves. Isohels are contour lines on a map indicating constant sunshine duration or intensity, used in climatology and solar energy studies. Understanding isoclines aids in solving differential equations, while isohels help map solar radiation patterns.
Defining Isocline: Meaning and Applications
An isocline represents a curve in a differential equation's slope field where the slope of the solution curve is constant, typically used in mathematical and engineering analyses to visualize solution behaviors without solving the equation explicitly. Unlike an isohel, which denotes lines of equal sunlight or solar radiation on Earth's surface, isoclines are essential in plotting and interpreting direction fields in dynamic systems and biological models. Applications of isoclines span population dynamics, physics, and economics, facilitating the understanding of equilibrium points and system stability.
Understanding Isohel: Definition and Uses
An isohel is a contour line on a weather map connecting points with equal hours of sunshine, helping meteorologists analyze solar radiation patterns and climate conditions. Isohels reveal regional variations in sunlight exposure, essential for agriculture planning, solar energy optimization, and ecological studies. Unlike isoclines, which represent lines of equal slope or gradient in geology and mathematics, isohels specifically map solar insolation, offering targeted data for environmental and renewable energy applications.
Key Differences Between Isocline and Isohel
Isoclines are curves on a graph representing points where the slope of a differential equation is constant, crucial in solving first-order differential equations. Isohels, on the other hand, are contour lines on a map connecting points with equal hours of sunlight, commonly used in climatology and geography. The key difference lies in their application: isoclines facilitate mathematical analysis of differential equations, while isohels analyze solar exposure patterns in environmental studies.
Importance of Isoclines in Geography and Ecology
Isoclines are crucial in geography and ecology as they represent lines of equal slope or gradient on a topographic map, aiding in the analysis of terrain stability and watershed management. Unlike isohels, which indicate lines of equal sunlight exposure influencing microclimates, isoclines help predict soil erosion patterns and vegetation distribution by illustrating terrain shape and incline. Their application supports environmental planning, ecosystem conservation, and natural hazard assessment by providing detailed insights into landform dynamics.
Role of Isohels in Climate and Weather Studies
Isohels, which are lines on weather maps connecting points of equal sunshine duration, play a crucial role in climate and weather studies by helping meteorologists analyze patterns of solar radiation and its effect on local weather conditions. These maps assist in identifying areas of consistent sunlight exposure, which influence temperature distribution, evaporation rates, and vegetation growth, thereby impacting climate models and predictions. Isoclines, by contrast, represent lines of equal slope or gradient in other scientific fields and are less directly connected to solar radiation analysis in meteorology.
Isocline vs Isohel: Visualization and Mapping Techniques
Isoclines represent lines connecting points of equal slope on a curve, commonly used in differential equations to visualize solution behaviors, while isohels depict lines of constant solar radiation intensity on geographic maps, essential for solar energy studies. Visualization of isoclines involves plotting directional fields or phase portraits to analyze system stability, whereas isohels utilize geographic information systems (GIS) and solar radiation models to map insolation patterns accurately. Mapping techniques for isoclines often include vector field diagrams, whereas isohel mapping integrates satellite data and terrain models to optimize solar panel placement and assess solar exposure.
Common Misconceptions about Isocline and Isohel
Isoclines and isohels are often confused due to their similar prefixes, but isoclines represent curves of constant slope in differential equations, while isohels are lines of equal sunlight exposure on maps. A common misconception is that both terms relate directly to meteorological data, though isoclines are primarily mathematical tools used in analyzing direction fields. Clarifying these distinctions improves understanding in fields like geography and mathematics where precise terminology is crucial.
Practical Examples: Isocline and Isohel in Real-world Applications
Isoclines are widely used in engineering and ecology to analyze differential equations that model population dynamics and chemical reactions, aiding in predicting system behavior under varying conditions. Isohels, contours of equal sunlight exposure, are essential in solar energy planning, agriculture, and urban design to optimize light usage for crop growth and building placement. Both isoclines and isohels provide critical spatial and functional insights that enhance decision-making in environmental management and renewable energy projects.
Summary: Choosing Between Isocline and Isohel for Data Representation
Isocline and Isohel are both contour lines used in data visualization, where isoclines connect points of equal slope or gradient in a field, and isohels connect points receiving equal sunlight or solar radiation. Selecting between isocline and isohel depends on the dataset's nature; isoclines are optimal for analyzing gradient-related phenomena like terrain slopes, while isohels excel in solar energy studies and environmental modeling. Effective data representation hinges on matching isocline or isohel to the spatial attribute being examined, ensuring precise interpretation and actionable insights.
Isocline Infographic