Slope measures the steepness or incline of a surface or line, typically expressed as a ratio or percentage. It plays a crucial role in fields like construction, engineering, and geography for determining drainage, stability, and safety. Explore the rest of the article to understand how slope impacts various applications and why it matters to you.
Table of Comparison
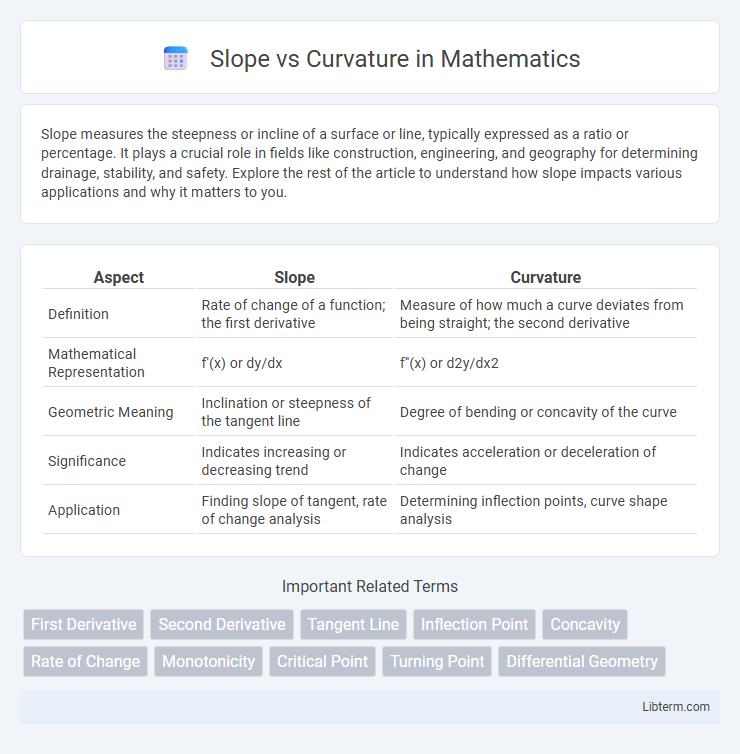
| Aspect | Slope | Curvature |
|---|---|---|
| Definition | Rate of change of a function; the first derivative | Measure of how much a curve deviates from being straight; the second derivative |
| Mathematical Representation | f'(x) or dy/dx | f''(x) or d2y/dx2 |
| Geometric Meaning | Inclination or steepness of the tangent line | Degree of bending or concavity of the curve |
| Significance | Indicates increasing or decreasing trend | Indicates acceleration or deceleration of change |
| Application | Finding slope of tangent, rate of change analysis | Determining inflection points, curve shape analysis |
Introduction to Slope and Curvature
Slope measures the rate of change in elevation between two points on a surface, representing the steepness or incline of terrain. Curvature describes the rate of change of the slope itself, indicating how the terrain bends or curves over a specific area. Understanding both slope and curvature is essential for applications in geomorphology, hydrology, and landscape analysis.
Defining Slope in Mathematical Terms
Slope in mathematical terms is defined as the ratio of the vertical change to the horizontal change between two points on a line, often expressed as Dy/Dx. It quantifies the rate of change or steepness of the line, providing essential information about the line's direction and angle. Unlike curvature, which measures how rapidly a curve deviates from being straight, slope strictly describes linear inclination.
Understanding Curvature: Key Concepts
Curvature measures the rate of change of slope along a curve, providing insight into how sharply a curve bends at a specific point. It is mathematically defined as the second derivative of a function or the inverse of the radius of the osculating circle at a given point. Understanding curvature is essential in fields such as differential geometry, computer graphics, and road design, where precise modeling of curves impacts performance and safety.
Mathematical Relationships Between Slope and Curvature
Slope represents the first derivative of a function, indicating the rate of change or the gradient at a specific point on a curve. Curvature quantifies the rate of change of the slope itself, mathematically expressed as the second derivative normalized by the first derivative's magnitude cubed. The curvature formula, k = |f''(x)| / [1 + (f'(x))2]^(3/2), reveals the intrinsic link between slope and curvature in differential geometry.
Applications of Slope in Real-World Scenarios
Slope plays a crucial role in various real-world applications such as civil engineering, where it determines the gradient of roads and railways to ensure safety and efficiency. In environmental science, slope analysis aids in watershed management and soil erosion prevention by assessing terrain inclination. Additionally, slope calculations are essential in finance for interpreting trends on graphs, helping to predict market movements and make investment decisions.
Practical Uses of Curvature Across Industries
Curvature plays a critical role in industries such as automotive design, where it informs the aerodynamics of vehicle bodies to reduce drag and improve fuel efficiency. In construction and civil engineering, curvature analysis helps in road and bridge design by ensuring structural stability and safety through precise bending and stress calculations. Medical imaging leverages curvature data to enhance the detection and diagnosis of anatomical abnormalities, improving patient outcomes with more accurate mapping of complex biological surfaces.
Differences Between Slope and Curvature
Slope measures the rate of change or steepness of a surface at a specific point, represented by the first derivative of a function, while curvature quantifies the degree to which the surface bends or deviates from being flat, corresponding to the second derivative. In terrain analysis, slope indicates the angle of incline, influencing water runoff and erosion, whereas curvature affects flow convergence and divergence by describing the concavity or convexity of the landscape. The fundamental difference lies in slope describing the gradient's magnitude and direction, whereas curvature captures the variation in the slope itself.
Visualizing Slope and Curvature on Graphs
Visualizing slope on graphs highlights the rate of change of a function, represented by the tangent line's steepness at any point. Curvature visualization reveals how sharply the graph bends, indicating concavity and the acceleration of change in the slope. Tools like derivatives and second derivatives provide precise numerical values for slope and curvature, enhancing understanding of function behavior on graphs.
Common Misconceptions About Slope vs Curvature
Common misconceptions about slope vs curvature often involve confusing slope with curvature as both relate to the shape of a function but represent fundamentally different concepts; slope measures the rate of change (first derivative), while curvature quantifies how quickly the slope itself changes (second derivative). Many mistakenly interpret zero slope as zero curvature, ignoring that curvature can be nonzero at points where the slope is flat. Another frequent error is assuming that a constant slope implies zero curvature, which neglects scenarios where a function's rate of change of slope varies despite a steady slope value across intervals.
Conclusion: Importance of Distinguishing Slope and Curvature
Distinguishing slope and curvature is crucial in fields like geology, cartography, and computer vision for accurate terrain analysis and feature extraction. Slope quantifies the rate of change in elevation, while curvature measures the rate of change of the slope itself, revealing concavity or convexity of the surface. Understanding their differences enhances precision in gradient assessment, erosion prediction, and surface modeling.
Slope Infographic