Median represents the middle value in a set of numbers when arranged in order, providing a crucial measure of central tendency that is less affected by outliers than the mean. Understanding the median is essential for accurately interpreting datasets in statistics, economics, and various analytical fields. Explore the rest of the article to learn how calculating the median can improve your data analysis skills and decision-making.
Table of Comparison
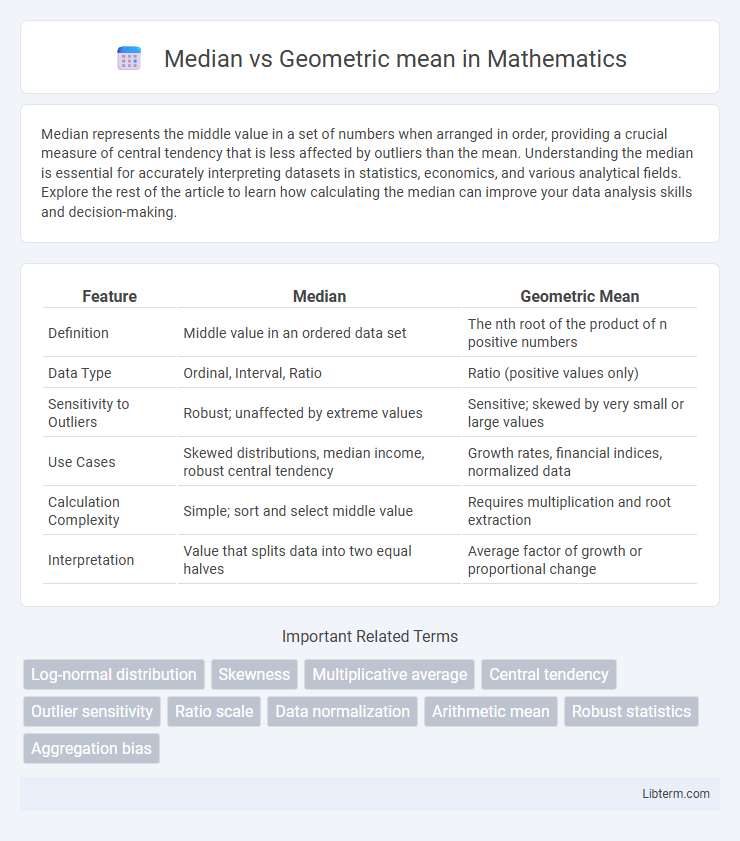
| Feature | Median | Geometric Mean |
|---|---|---|
| Definition | Middle value in an ordered data set | The nth root of the product of n positive numbers |
| Data Type | Ordinal, Interval, Ratio | Ratio (positive values only) |
| Sensitivity to Outliers | Robust; unaffected by extreme values | Sensitive; skewed by very small or large values |
| Use Cases | Skewed distributions, median income, robust central tendency | Growth rates, financial indices, normalized data |
| Calculation Complexity | Simple; sort and select middle value | Requires multiplication and root extraction |
| Interpretation | Value that splits data into two equal halves | Average factor of growth or proportional change |
Understanding Median: Definition and Calculation
The median is the middle value in a data set when the numbers are arranged in ascending or descending order, dividing the dataset into two equal halves. For odd-numbered datasets, the median is the central number, and for even-numbered datasets, it is the average of the two middle numbers. Unlike the geometric mean, the median is less affected by extreme values, making it a robust measure of central tendency for skewed distributions.
Geometric Mean Explained: Concepts and Uses
Geometric mean measures the central tendency by multiplying values and taking the nth root, making it ideal for datasets with exponential growth such as investment returns or population rates. Unlike the median, the geometric mean accounts for the compounding effect and provides a more accurate average in multiplicative processes. It is widely used in finance, biology, and environmental studies to analyze data sets where proportions or ratios are key factors.
Key Differences Between Median and Geometric Mean
The median represents the middle value in a sorted data set, providing a robust measure of central tendency that is unaffected by extreme values or skewed distributions. The geometric mean calculates the nth root of the product of n positive values, emphasizing multiplicative relationships and growth rates, especially in financial and biological datasets. Key differences include sensitivity to data scale and distribution, with the median suited for ordinal or skewed data and the geometric mean ideal for ratios and proportionate changes.
Advantages of Using Median in Data Analysis
The median provides a robust measure of central tendency that is less affected by outliers and skewed data distributions than the geometric mean. It accurately reflects the midpoint of a dataset, making it ideal for interpreting income data, real estate prices, and other economic indicators with extreme values. The median's simplicity and resilience improve the accuracy of decisions in fields like healthcare, finance, and social sciences where stable central measures are crucial.
Benefits of Applying Geometric Mean
The geometric mean excels when analyzing data with multiplicative relationships or varying scales, such as growth rates, financial returns, and ratios, providing a more accurate measure of central tendency for proportional data. Unlike the median, the geometric mean accounts for the product of values, which reduces distortion from extreme values in skewed distributions. It is especially beneficial in evaluating compound interest, investment portfolio performance, and environmental data where measurements multiply over time.
When to Use Median vs Geometric Mean
The median is best used when analyzing data with outliers or skewed distributions because it represents the middle value and is not affected by extreme numbers. The geometric mean is appropriate for datasets involving rates of growth, ratios, or percentages, such as financial returns or population growth, where the multiplicative relationship between values is important. Use the geometric mean when averaging values that are products or exponential in nature, ensuring a more accurate central tendency measurement in these contexts.
Real-World Examples: Median vs Geometric Mean
The median is often preferred in income data analysis because it accurately represents the middle value without being distorted by extreme outliers, such as exceptionally high earners. In contrast, the geometric mean is ideal for measuring average rates of return in finance or growth rates in populations, as it accounts for compounding effects over time. For example, while the median income gives a realistic snapshot of typical earnings, the geometric mean provides a more meaningful average for investment growth, highlighting its suitability in financial contexts.
Handling Skewed Data: Median or Geometric Mean?
The median is more effective for handling skewed data because it represents the middle value, minimizing the impact of extreme outliers. In contrast, the geometric mean is sensitive to zeros and negative values, making it less reliable when dealing with highly skewed distributions. For datasets with positive values and moderate skewness, the geometric mean can provide a better measure of central tendency by emphasizing multiplicative relationships, but the median remains robust in most skewed scenarios.
Common Mistakes in Interpreting Median and Geometric Mean
Common mistakes in interpreting median and geometric mean often stem from misunderstanding their distinct applications: the median represents the middle value in a data set and is robust against outliers, while the geometric mean is appropriate for datasets involving multiplicative processes like growth rates. Confusing these measures can lead to inaccurate conclusions, such as using the geometric mean for additive data or interpreting the median in a context requiring compounded averages. Misapplication frequently occurs in financial analysis and environmental studies where the geometric mean accurately reflects average rates of change but is mistaken for a median-like central tendency.
Summary Table: Median vs Geometric Mean Comparison
The summary table comparing median and geometric mean highlights their key differences in measuring central tendency, where the median provides the midpoint of a data set unaffected by extreme values, while the geometric mean calculates the nth root of the product of values, suitable for proportional growth rates. Median excels in skewed distributions and ordinal data analysis, whereas geometric mean is optimal for multiplicative processes such as financial returns or biological growth. Understanding these distinctions aids in selecting the appropriate measure for accurate data interpretation and analysis.
Median Infographic