Skew refers to the asymmetry or distortion in data distribution where values tend to cluster more on one side, affecting statistical analysis and interpretation. Understanding skewness is crucial for making accurate predictions and decisions based on your data sets. Discover how to identify and address skew in your data by reading the rest of the article.
Table of Comparison
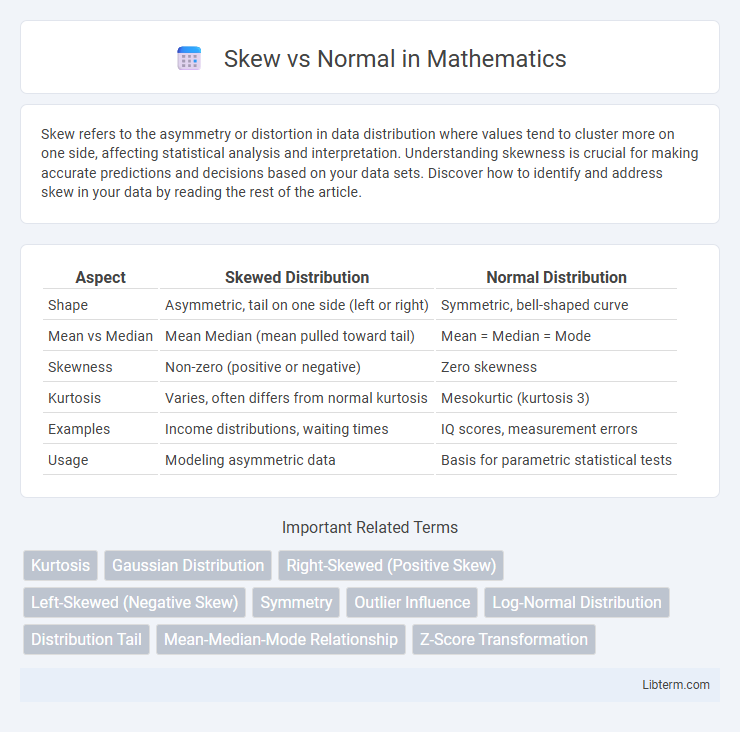
| Aspect | Skewed Distribution | Normal Distribution |
|---|---|---|
| Shape | Asymmetric, tail on one side (left or right) | Symmetric, bell-shaped curve |
| Mean vs Median | Mean Median (mean pulled toward tail) | Mean = Median = Mode |
| Skewness | Non-zero (positive or negative) | Zero skewness |
| Kurtosis | Varies, often differs from normal kurtosis | Mesokurtic (kurtosis 3) |
| Examples | Income distributions, waiting times | IQ scores, measurement errors |
| Usage | Modeling asymmetric data | Basis for parametric statistical tests |
Understanding Skewness and Normal Distribution
Skewness measures the asymmetry of data distribution, indicating whether values cluster more on one side of the mean compared to a normal distribution, which is perfectly symmetrical. Positive skewness shows a longer right tail, while negative skewness reveals a longer left tail, deviating from the bell curve shape of normal distribution. Understanding the degree of skewness helps in selecting appropriate statistical methods and accurately interpreting data variability.
Key Differences Between Skew and Normal Distributions
Skew distributions exhibit asymmetry where data tails off more to one side, contrasting with normal distributions that are perfectly symmetrical around the mean. The mean, median, and mode in skewed distributions differ, while they coincide in normal distributions. Skewness affects statistical analyses by influencing measures of central tendency and variability, whereas normal distributions simplify many inferential statistics due to their predictable shape and properties.
Characteristics of a Normal Distribution
A normal distribution is characterized by its symmetric, bell-shaped curve centered around the mean, with data tapering off equally on both sides, indicating no skewness. Its mean, median, and mode are all equal, reflecting perfect balance and central tendency in the dataset. The distribution follows the empirical rule where approximately 68% of data falls within one standard deviation, 95% within two, and 99.7% within three standard deviations from the mean.
Characteristics of a Skewed Distribution
A skewed distribution exhibits asymmetry where data clusters more heavily on one side, resulting in a long tail either on the left (negative skew) or right (positive skew). This distortion impacts measures of central tendency, causing the mean to shift toward the tail, deviating from the median and mode. Skewness affects statistical analyses by violating normality assumptions, influencing variance assessments and hypothesis testing outcomes.
Visual Representation: Skew vs Normal Curves
Skewed distributions visually differ from normal curves by displaying asymmetry, where the tail extends more to one side--either left (negative skew) or right (positive skew), contrasting with the symmetric bell-shaped normal curve. In a normal curve, data clusters evenly around the mean, producing mirrored sides and a central peak, while skewed curves show a stretched tail that indicates data concentration shifted away from the mean. This visual distinction aids in identifying distribution bias, affecting statistical measures such as mean, median, and mode alignment.
Causes of Skewness in Data
Skewness in data occurs when the distribution is asymmetrical, often caused by outliers, data entry errors, or natural variability in the dataset. Positive skew indicates a long tail on the right side, frequently resulting from extreme high values, while negative skew reflects a long tail on the left due to extreme low values. Understanding these causes is crucial for selecting appropriate statistical methods and accurately interpreting data trends.
Impact of Skewness on Statistical Analysis
Skewness measures the asymmetry of data distribution, influencing statistical analysis by affecting mean, median, and mode relationships, which can bias results if normality assumptions are violated. Positively skewed data often leads to underestimating the central tendency using mean, while negatively skewed data can cause overestimation, impacting hypothesis tests and confidence intervals. Many parametric tests assume normal distribution, so significant skewness necessitates data transformation or nonparametric methods to ensure accurate inference.
Detecting and Measuring Skewness
Detecting skewness involves analyzing the asymmetry of a data distribution, which can be quantified using statistical measures such as Pearson's skewness coefficients and the sample skewness formula. Normal distributions have a skewness value near zero, indicating symmetry, while positive or negative skewness signifies a distribution that tails off to the right or left, respectively. Measuring skewness accurately aids in selecting appropriate statistical methods and transformation techniques for data normalization.
Handling Skewed Data: Transformation Techniques
Handling skewed data effectively involves applying transformation techniques such as logarithmic, square root, or Box-Cox transformations to reduce skewness and stabilize variance. These methods help normalize the distribution, making statistical analyses like regression and hypothesis testing more reliable. Selecting the appropriate transformation depends on the degree and type of skewness present in the dataset, enhancing model accuracy and interpretability.
Real-World Applications: Normal vs Skewed Data
Normal distributions commonly model real-world data such as heights, test scores, and measurement errors, enabling effective use of statistical methods like linear regression and hypothesis testing. Skewed data appears frequently in income, housing prices, and response times, requiring alternative approaches such as data transformations or non-parametric tests to accurately capture distribution characteristics. Understanding the shape of data distributions is crucial for selecting appropriate analytical techniques and ensuring valid inference in practical applications.
Skew Infographic