Contribution margin reveals the profitability of individual products by calculating the difference between sales revenue and variable costs. Understanding this metric helps Your business make informed decisions about pricing, production levels, and product mix to maximize profit. Dive deeper into the article to explore how mastering contribution margin can boost Your financial strategy.
Table of Comparison
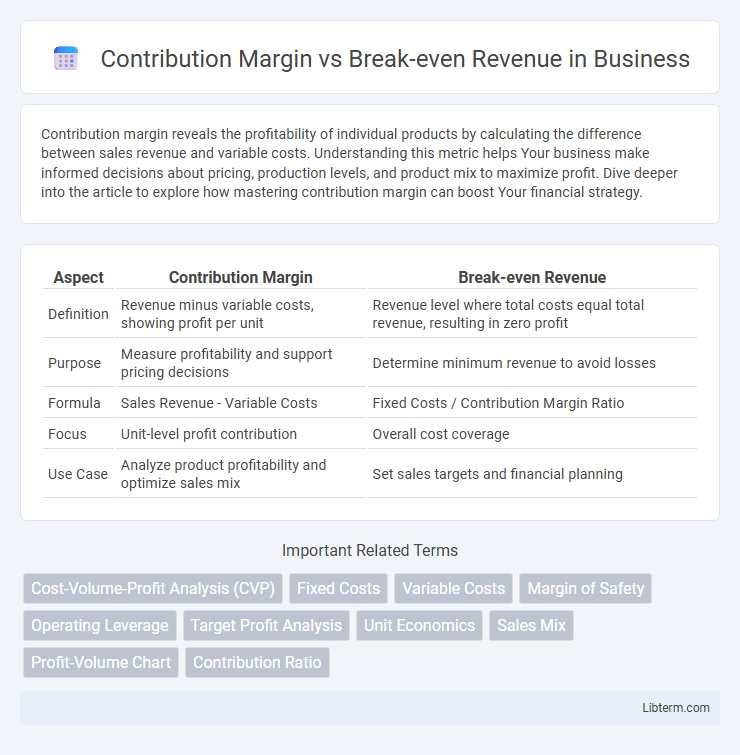
| Aspect | Contribution Margin | Break-even Revenue |
|---|---|---|
| Definition | Revenue minus variable costs, showing profit per unit | Revenue level where total costs equal total revenue, resulting in zero profit |
| Purpose | Measure profitability and support pricing decisions | Determine minimum revenue to avoid losses |
| Formula | Sales Revenue - Variable Costs | Fixed Costs / Contribution Margin Ratio |
| Focus | Unit-level profit contribution | Overall cost coverage |
| Use Case | Analyze product profitability and optimize sales mix | Set sales targets and financial planning |
Understanding Contribution Margin
Contribution margin represents the amount remaining from sales revenue after variable costs are subtracted, which contributes to covering fixed costs and generating profit. Understanding contribution margin is essential for determining how many units need to be sold to reach the break-even revenue, where total costs equal total sales. Analyzing contribution margin helps businesses optimize pricing, control variable costs, and improve overall profitability strategies.
Defining Break-even Revenue
Break-even revenue is the total sales amount a business needs to cover all its fixed and variable costs, resulting in zero profit or loss. It is calculated by dividing total fixed costs by the contribution margin ratio, which represents the percentage of each sales dollar available to cover fixed costs after variable costs are deducted. Understanding break-even revenue helps businesses set sales targets and assess financial viability before generating profit.
Key Differences Between Contribution Margin and Break-even Revenue
Contribution margin represents the amount remaining from sales revenue after variable costs are deducted, indicating how much contributes to covering fixed costs and generating profit. Break-even revenue is the total sales income required to cover both fixed and variable costs, resulting in zero net profit or loss. The key difference lies in contribution margin measuring profit potential per unit sold, whereas break-even revenue specifies the sales level needed to avoid losses.
Importance of Contribution Margin in Business Analysis
Contribution margin represents the revenue remaining after variable costs are deducted, serving as a critical measure for assessing a product's profitability and its ability to cover fixed expenses. Unlike break-even revenue, which identifies the sales volume needed to avoid losses, contribution margin provides deeper insight into profit potential and cost structure management. Businesses rely on contribution margin analysis to make informed decisions on pricing strategies, product prioritization, and cost control for maximizing overall profitability.
Calculating Contribution Margin: Step-by-Step
Calculating contribution margin involves subtracting variable costs from total sales revenue, highlighting the amount available to cover fixed costs and generate profit. The formula is Contribution Margin = Sales Revenue - Variable Costs, which can be expressed per unit or as a ratio. Understanding contribution margin aids in determining break-even revenue by dividing total fixed costs by the contribution margin ratio.
Determining Break-even Revenue: Formulas and Examples
Determining break-even revenue involves calculating the point at which total revenue covers all fixed and variable costs, resulting in zero profit or loss. The formula for break-even revenue is Break-even Revenue = Fixed Costs / Contribution Margin Ratio, where the contribution margin ratio is calculated as (Sales Revenue - Variable Costs) / Sales Revenue. For example, if fixed costs are $50,000 and the contribution margin ratio is 40%, the break-even revenue would be $50,000 / 0.40 = $125,000.
How Contribution Margin Influences Pricing Strategies
Contribution margin directly impacts pricing strategies by highlighting the portion of sales revenue available to cover fixed costs and generate profit after variable costs are deducted. Higher contribution margins enable businesses to set competitive prices while maintaining profitability, allowing for strategic adjustments based on cost structure and market conditions. Understanding contribution margin aids in identifying the break-even revenue point, ensuring prices cover all costs to avoid losses.
Interplay Between Contribution Margin and Break-even Analysis
Contribution margin plays a critical role in break-even analysis by determining the amount each unit sold contributes toward covering fixed costs, directly influencing the break-even revenue point. A higher contribution margin reduces the break-even revenue, enabling businesses to achieve profitability faster with lower sales volume. Understanding the interplay between contribution margin and break-even revenue allows for more accurate pricing, cost control, and financial forecasting decisions.
Common Mistakes in Contribution Margin and Break-even Calculations
Misinterpreting fixed and variable costs often leads to errors in contribution margin calculations, causing inaccurate profitability analysis. Confusing break-even revenue with total sales revenue results in overestimating required sales to cover costs. Overlooking the impact of changing cost structures and sales mix can distort both contribution margin and break-even point estimations.
Practical Applications: Maximizing Profit Using Both Metrics
Contribution margin helps identify the amount each unit contributes toward covering fixed costs and generating profit, enabling businesses to set sales targets efficiently. Break-even revenue pinpoints the minimum sales needed to avoid losses, ensuring informed decisions on pricing and cost control. Using both metrics allows companies to maximize profit by balancing cost management with strategic sales planning.
Contribution Margin Infographic