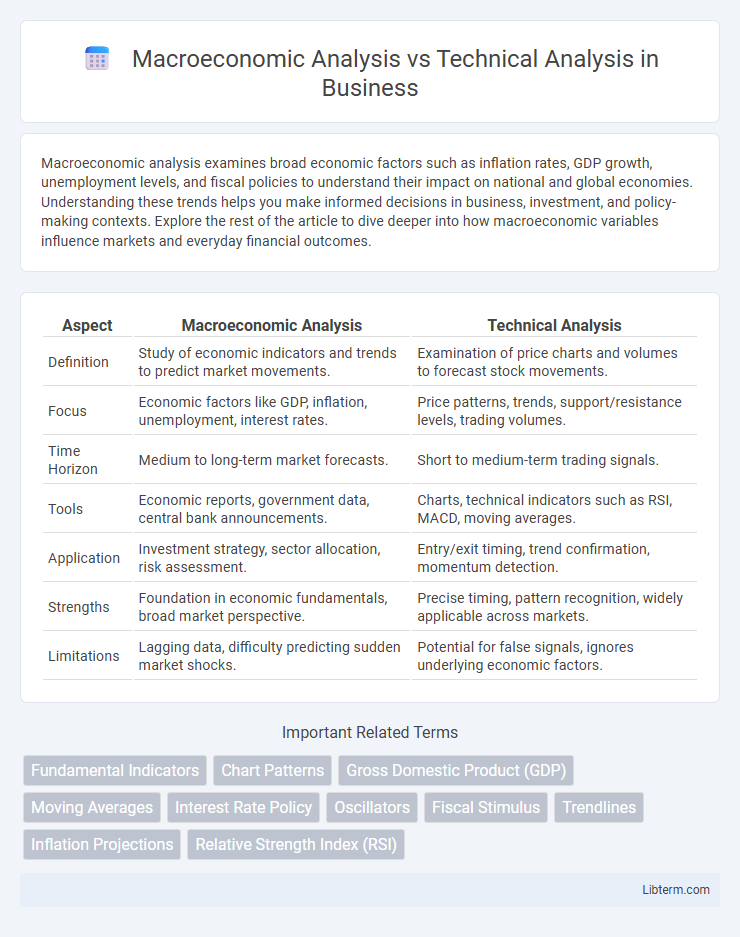
Macroeconomic analysis examines broad economic factors such as inflation rates, GDP growth, unemployment levels, and fiscal policies to understand their impact on national and global economies. Understanding these trends helps you make informed decisions in business, investment, and policy-making contexts. Explore the rest of the article to dive deeper into how macroeconomic variables influence markets and everyday financial outcomes.
Table of Comparison
| Aspect | Macroeconomic Analysis | Technical Analysis |
|---|---|---|
| Definition | Study of economic indicators and trends to predict market movements. | Examination of price charts and volumes to forecast stock movements. |
| Focus | Economic factors like GDP, inflation, unemployment, interest rates. | Price patterns, trends, support/resistance levels, trading volumes. |
| Time Horizon | Medium to long-term market forecasts. | Short to medium-term trading signals. |
| Tools | Economic reports, government data, central bank announcements. | Charts, technical indicators such as RSI, MACD, moving averages. |
| Application | Investment strategy, sector allocation, risk assessment. | Entry/exit timing, trend confirmation, momentum detection. |
| Strengths | Foundation in economic fundamentals, broad market perspective. | Precise timing, pattern recognition, widely applicable across markets. |
| Limitations | Lagging data, difficulty predicting sudden market shocks. | Potential for false signals, ignores underlying economic factors. |
Introduction to Macroeconomic and Technical Analysis
Macroeconomic analysis examines large-scale economic indicators such as GDP growth, inflation rates, unemployment levels, and fiscal policies to assess the overall economic environment and forecast market trends. Technical analysis relies on historical price data, trading volumes, chart patterns, and technical indicators like moving averages and Relative Strength Index (RSI) to predict future price movements in financial markets. Understanding both approaches enables investors to combine fundamental economic insights with market behavior patterns for more informed decision-making.
Defining Macroeconomic Analysis
Macroeconomic analysis examines overall economic indicators such as GDP growth, inflation rates, unemployment figures, and fiscal policies to assess market trends and investment risks. This approach evaluates how government actions, global economic shifts, and monetary policies impact financial markets and asset prices over time. Investors rely on macroeconomic data to anticipate economic cycles and make informed decisions beyond price movements captured by technical analysis.
Understanding Technical Analysis
Technical analysis involves studying historical price charts and trading volumes to forecast future market movements based on patterns and trends. It emphasizes identifying support and resistance levels, moving averages, and momentum indicators to predict price direction with a focus on short-term market behavior. Traders rely on tools such as candlestick patterns, Relative Strength Index (RSI), and Bollinger Bands to make informed entry and exit decisions.
Core Principles of Macroeconomic Analysis
Macroeconomic analysis centers on evaluating broad economic indicators such as GDP growth, inflation rates, unemployment levels, and fiscal policies to forecast market trends and investment risks. It emphasizes understanding systemic economic dynamics and the impact of government monetary and fiscal interventions on overall economic health. This approach contrasts with technical analysis, which relies on historical price patterns and trading volumes to predict future market movements.
Key Tools in Technical Analysis
Key tools in technical analysis include chart patterns such as head and shoulders, moving averages like the 50-day and 200-day MA, and technical indicators including the Relative Strength Index (RSI) and Moving Average Convergence Divergence (MACD). Volume analysis and trendlines help traders identify momentum and potential reversal points by analyzing price action and trading volume. These tools provide insights into market sentiment and timing decisions, contrasting with macroeconomic analysis which relies on economic indicators and fundamental data.
Data Sources: Economic Indicators vs. Price Charts
Macroeconomic analysis relies heavily on economic indicators such as GDP growth rates, unemployment figures, inflation rates, and consumer confidence indexes to assess overall economic health and predict market trends. Technical analysis focuses on price charts, including candlestick patterns, moving averages, and volume data, to identify trends and market momentum through historical price movements. While macroeconomic data comes from government reports and international organizations, technical analysis utilizes real-time trading data sourced from exchanges and charting platforms.
Time Horizon: Long-Term vs. Short-Term Approaches
Macroeconomic analysis emphasizes long-term trends by examining economic indicators such as GDP growth, inflation rates, and employment data to assess overall market conditions. Technical analysis focuses on short-term price movements using charts, patterns, and trading volumes to identify entry and exit points. Investors blend these approaches by leveraging macroeconomic insights for strategic positioning and technical signals for tactical timing.
Strengths and Limitations of Macroeconomic Analysis
Macroeconomic analysis excels in providing a broad understanding of economic trends, informing long-term investment decisions through indicators like GDP growth, inflation rates, and employment data, which reflect overall market conditions. Its strength lies in capturing systemic economic shifts and policy impacts, yet it can be limited by lagging data, the complexity of global interdependencies, and difficulty in predicting short-term market movements. This analysis often requires integration with other methods, like technical analysis, to enhance timing and precision in trading strategies.
Pros and Cons of Technical Analysis
Technical analysis offers the advantage of identifying market trends and price patterns through historical data, enabling short-term trading decisions based on charts and indicators. However, it can be limited by its reliance on past price movements without considering fundamental economic factors, leading to potential false signals. The method's effectiveness may decrease in highly volatile or news-driven markets where external events significantly impact prices.
Integrating Both Analyses for Investment Decisions
Integrating macroeconomic analysis with technical analysis enhances investment decisions by combining broad economic indicators like GDP growth, inflation rates, and monetary policy with price trends, trading volumes, and chart patterns. Macroeconomic data provides context for market movements, while technical signals fine-tune entry and exit points. This dual approach improves risk management and portfolio performance by aligning fundamental economic conditions with market behavior insights.
Macroeconomic Analysis Infographic

 libterm.com