The contract curve represents all efficient allocations where no party can be made better off without making another worse off, crucial in economic theory and game theory. It defines the set of Pareto optimal points within the Edgeworth box, illustrating mutual gains from trade and optimal resource distribution. Explore the rest of the article to understand how the contract curve impacts negotiation strategies and market equilibrium.
Table of Comparison
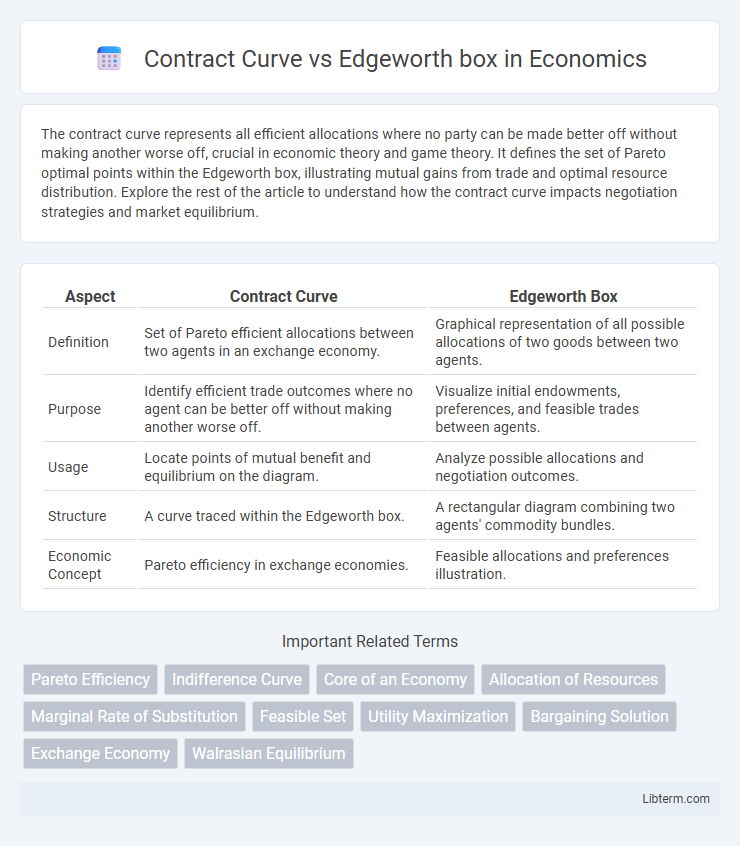
| Aspect | Contract Curve | Edgeworth Box |
|---|---|---|
| Definition | Set of Pareto efficient allocations between two agents in an exchange economy. | Graphical representation of all possible allocations of two goods between two agents. |
| Purpose | Identify efficient trade outcomes where no agent can be better off without making another worse off. | Visualize initial endowments, preferences, and feasible trades between agents. |
| Usage | Locate points of mutual benefit and equilibrium on the diagram. | Analyze possible allocations and negotiation outcomes. |
| Structure | A curve traced within the Edgeworth box. | A rectangular diagram combining two agents' commodity bundles. |
| Economic Concept | Pareto efficiency in exchange economies. | Feasible allocations and preferences illustration. |
Introduction to Contract Curve and Edgeworth Box
The Edgeworth box is a graphical representation used in microeconomics to illustrate the distribution of resources and potential trades between two parties, showcasing all possible allocations that make both individuals better off. The contract curve lies within this box, representing the set of Pareto efficient allocations where no party can improve their situation without making the other worse off. This curve highlights the mutually beneficial trades and optimal resource distributions that emerge from bargaining between the two agents.
Understanding the Edgeworth Box Framework
The Edgeworth Box framework illustrates the set of possible allocations between two agents, where each point inside the box represents a different distribution of goods, reflecting their initial endowments. The contract curve within this box identifies all Pareto efficient allocations where no further mutual gains from trade are possible. Understanding the edgeworth box is crucial for analyzing how individuals can optimize resource allocation through voluntary exchange, with the contract curve highlighting equilibrium outcomes.
Definition and Role of the Contract Curve
The contract curve represents all efficient allocations where no party can be made better off without making another worse off within an Edgeworth box, which illustrates the distribution of resources between two agents. Its role is to identify mutually beneficial trades that lead to Pareto optimal outcomes in exchange economies. The Edgeworth box provides the framework for visualizing initial endowments and potential reallocations, while the contract curve marks the set of feasible, efficient agreements.
Visualizing Trade: Indifference Curves in the Edgeworth Box
The Edgeworth box visually represents the distribution of two goods between two individuals using indifference curves, illustrating all possible allocations where both parties' utilities are maximized. The contract curve lies within this box, tracing points where the indifference curves of both individuals are tangent, indicating efficient trades that cannot make one party better off without making the other worse off. By analyzing these tangency points, the contract curve reveals the set of Pareto optimal allocations, crucial for understanding mutually beneficial exchange in economic theory.
Deriving the Contract Curve Step-by-Step
Deriving the contract curve within an Edgeworth box involves identifying all points where consumers' indifference curves are tangent, indicating mutually beneficial trades without further gains from exchange. Begin by setting the marginal rates of substitution (MRS) of the two agents equal to each other, reflecting their willingness to trade goods at the same rate. Solve this equality using the resource constraints of the Edgeworth box to trace the locus of Pareto efficient allocations, which forms the contract curve.
Efficiency and Pareto Optimality within the Box
The Contract Curve within the Edgeworth box represents all Pareto efficient allocations where no individual can be made better off without making another worse off. Each point on this curve depicts optimal resource distribution between two agents, ensuring maximum joint efficiency. By tracing the Contract Curve, economists can identify mutually beneficial trades that lead to Pareto improvements inside the Edgeworth box framework.
Differences Between Contract Curve and Edgeworth Box
The Contract Curve represents the set of efficient allocations where both parties maximize their utilities in a two-person exchange economy, reflecting mutually beneficial trades. The Edgeworth Box is a graphical tool that illustrates all possible allocations of two goods between two individuals and their respective utility levels. While the Contract Curve lies within the Edgeworth Box as the locus of Pareto optimal points, the Edgeworth Box encompasses the entire spectrum of feasible allocations, including inefficient and dominated trades.
Applications in Exchange and Production Economies
The Contract Curve represents the set of efficient trades where no party can be made better off without making another worse off, crucial in analyzing Pareto optimal allocations within the Edgeworth box framework. In exchange economies, it illustrates all possible mutually beneficial allocations of goods between agents, guiding optimal negotiation and trade decisions. For production economies, the curve helps identify efficient resource allocations between different production processes, ensuring maximum output and optimal factor distribution.
Real-World Examples Illustrating Both Concepts
The Contract Curve represents all efficient allocations in an Edgeworth box, illustrating optimal trade-offs between two agents' resources, as seen in real-world negotiations like labor contracts where employers and employees find mutually beneficial terms. The Edgeworth box itself visually models the entire range of possible allocations between two parties, such as international trade agreements where countries exchange goods to maximize utility. Understanding these concepts aids in optimizing resource allocation in economics, for example in housing markets where buyers and sellers negotiate prices within feasible trading sets defined by the Edgeworth box.
Conclusion: Insights from Contract Curve vs Edgeworth Box
The Contract Curve represents the set of all Pareto-efficient allocations within the Edgeworth Box, illustrating the mutually beneficial trades between two agents. By mapping preferences and initial endowments in the Edgeworth Box, the Contract Curve identifies points where no further gains from trade are possible, highlighting optimal efficiency. This relationship underscores the fundamental insight that the Contract Curve serves as a visual and analytical tool for understanding equilibrium allocations in bilateral bargaining scenarios.
Contract Curve Infographic