Consumer surplus represents the difference between what consumers are willing to pay for a good and what they actually pay, reflecting the extra benefit received. Producer surplus measures the difference between the price producers receive and the minimum price at which they are willing to supply the good, indicating the profit gained. Explore this article to understand how these concepts influence market efficiency and your economic decisions.
Table of Comparison
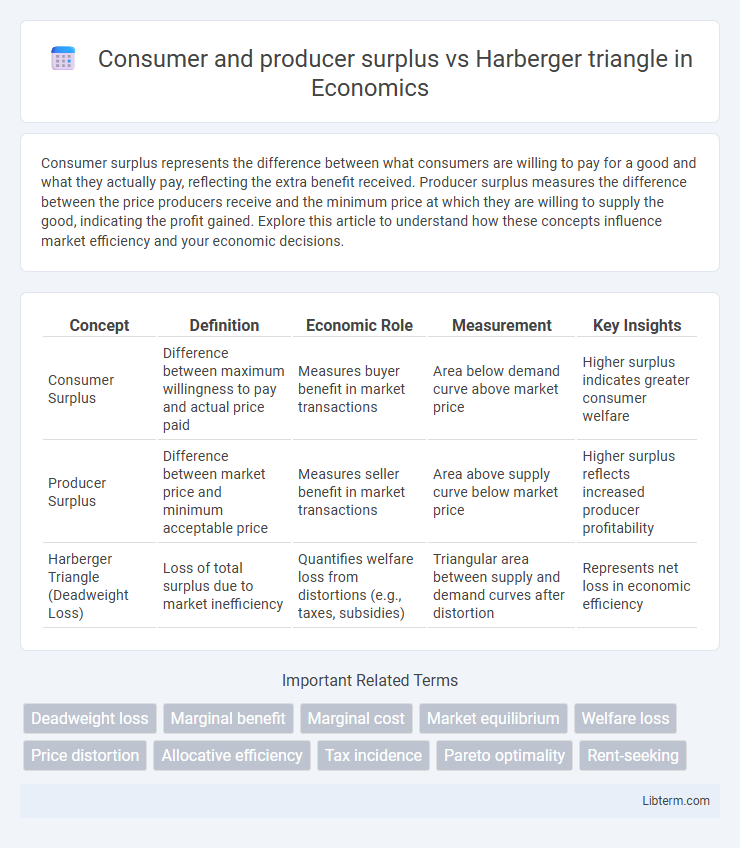
| Concept | Definition | Economic Role | Measurement | Key Insights |
|---|---|---|---|---|
| Consumer Surplus | Difference between maximum willingness to pay and actual price paid | Measures buyer benefit in market transactions | Area below demand curve above market price | Higher surplus indicates greater consumer welfare |
| Producer Surplus | Difference between market price and minimum acceptable price | Measures seller benefit in market transactions | Area above supply curve below market price | Higher surplus reflects increased producer profitability |
| Harberger Triangle (Deadweight Loss) | Loss of total surplus due to market inefficiency | Quantifies welfare loss from distortions (e.g., taxes, subsidies) | Triangular area between supply and demand curves after distortion | Represents net loss in economic efficiency |
Introduction to Consumer and Producer Surplus
Consumer surplus represents the difference between what consumers are willing to pay for a good and what they actually pay, reflecting the net benefit to buyers in a market. Producer surplus measures the difference between the market price and the minimum price at which producers are willing to sell, indicating the net benefit to sellers. The Harberger triangle illustrates the deadweight loss that results from market distortions, such as taxes or subsidies, by showing the reduction in total surplus where consumer and producer surpluses are not maximized.
Understanding the Harberger Triangle
The Harberger triangle represents the deadweight loss in a market caused by distortions such as taxes or subsidies, illustrating the reduction in total welfare by showing the lost consumer and producer surplus. Unlike consumer and producer surplus, which measure the benefits received by buyers and sellers, the Harberger triangle specifically quantifies the efficiency loss due to misallocation of resources. Understanding the Harberger triangle is crucial for analyzing the trade-offs policymakers face when imposing taxes or regulations that affect market equilibrium.
Key Differences: Surplus vs. Deadweight Loss
Consumer and producer surplus represent the total benefits to buyers and sellers in a market, measuring economic welfare gains from trade, while the Harberger triangle quantifies deadweight loss, reflecting efficiency losses due to market distortions like taxes or subsidies. Surplus captures actual gains realized under equilibrium conditions, whereas the Harberger triangle highlights lost social welfare caused by deviations from optimal allocation. Understanding these distinctions is crucial for evaluating policy impacts on overall economic efficiency.
Graphical Representation of Surpluses and the Harberger Triangle
The graphical representation of consumer and producer surplus illustrates areas under demand and supply curves, depicting total economic benefit before market interventions. The Harberger triangle quantifies the deadweight loss caused by market distortions, shown as the triangular area between reduced quantities traded due to taxes or price controls. This triangle highlights the loss in combined surplus, visually emphasizing inefficiency and welfare reduction in the market.
Mathematical Calculation of Surplus and Deadweight Loss
Consumer surplus is calculated as the area between the demand curve and the market price, representing the difference between what consumers are willing to pay and what they actually pay. Producer surplus equals the area above the supply curve and below the market price, reflecting the difference between producers' revenue and their minimum acceptable price. The Harberger triangle quantifies deadweight loss by measuring the reduction in total surplus due to market inefficiencies like taxes or price controls, mathematically represented as the triangular area between supply and demand curves corresponding to lost trades.
Economic Efficiency and Social Welfare Implications
Consumer and producer surplus quantify the net benefits to buyers and sellers from market transactions, reflecting the total economic welfare generated. The Harberger triangle represents the deadweight loss resulting from market distortions, such as taxes or subsidies, causing a misallocation of resources and reducing overall economic efficiency. Understanding the interplay between surplus measures and the Harberger triangle is crucial for assessing social welfare implications and designing policies that minimize welfare losses.
Real-World Examples of Consumer and Producer Surplus
Consumer and producer surplus represent the benefits buyers and sellers receive from market transactions, measurable as the difference between willingness to pay and actual price, and between actual price and minimum acceptable price, respectively. Real-world examples include agricultural markets where farmers gain producer surplus when crop prices exceed production costs, and consumers enjoy consumer surplus when purchasing goods below their maximum willingness to pay. The Harberger triangle quantifies the deadweight loss caused by market distortions, such as taxes or tariffs, which reduce the total surplus by shrinking both consumer and producer benefits.
Policy Impacts: Taxes, Subsidies, and Market Interventions
Consumer surplus and producer surplus measure welfare changes resulting from taxes, subsidies, and market interventions; taxes typically reduce both surpluses by increasing prices consumers pay and lowering prices producers receive, while subsidies increase surpluses by lowering consumer costs or raising producer revenues. The Harberger triangle represents the deadweight loss created by these interventions, quantifying the lost economic efficiency when markets deviate from equilibrium due to distorted incentives. Policymakers use the Harberger triangle to evaluate the cost of inefficient resource allocation caused by taxation or subsidies, balancing revenue generation or market support against the welfare loss to consumers and producers.
Limitations of Surplus and Harberger Triangle Analysis
Consumer and producer surplus measures often overlook dynamic market factors such as entry barriers, externalities, and distributional impacts, limiting their comprehensive assessment of welfare changes. The Harberger triangle, representing deadweight loss, assumes perfect competition and static conditions, leading to inaccuracies in markets with imperfections or scale economies. Both approaches fail to capture long-term efficiency effects, innovation incentives, and heterogeneous agent responses, restricting their policy relevance under complex real-world scenarios.
Conclusion: Comparing Surplus Measures and Harberger Triangle
Consumer and producer surplus measures quantify the total welfare gains from market transactions by capturing benefits to buyers and sellers, while the Harberger triangle specifically estimates the welfare loss due to market distortions like taxes or monopolies. Comparing these metrics reveals that consumer and producer surpluses represent gross benefits, whereas the Harberger triangle focuses on deadweight loss, indicating efficiency losses in resource allocation. Accurate economic assessments require integrating both surpluses and the Harberger triangle to fully understand the trade-offs between welfare gains and efficiency losses in policy analysis.
Consumer and producer surplus Infographic