Deadweight loss occurs when market inefficiencies prevent optimal allocation of resources, leading to lost total surplus. It often arises from price controls, taxes, or monopolistic practices that distort supply and demand. Discover how understanding deadweight loss can help you make better economic decisions by exploring the full article.
Table of Comparison
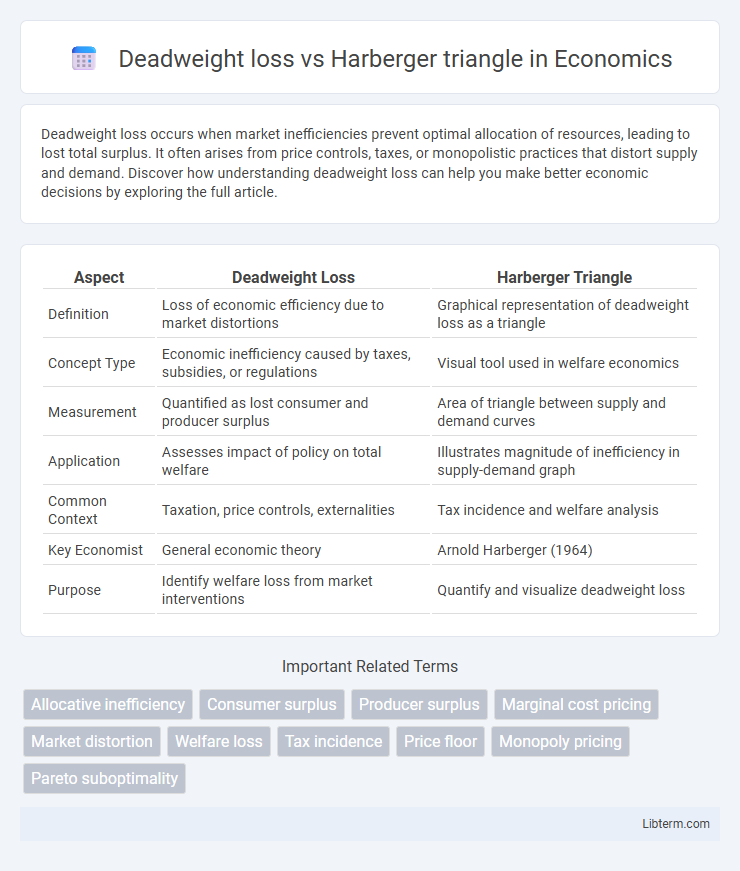
| Aspect | Deadweight Loss | Harberger Triangle |
|---|---|---|
| Definition | Loss of economic efficiency due to market distortions | Graphical representation of deadweight loss as a triangle |
| Concept Type | Economic inefficiency caused by taxes, subsidies, or regulations | Visual tool used in welfare economics |
| Measurement | Quantified as lost consumer and producer surplus | Area of triangle between supply and demand curves |
| Application | Assesses impact of policy on total welfare | Illustrates magnitude of inefficiency in supply-demand graph |
| Common Context | Taxation, price controls, externalities | Tax incidence and welfare analysis |
| Key Economist | General economic theory | Arnold Harberger (1964) |
| Purpose | Identify welfare loss from market interventions | Quantify and visualize deadweight loss |
Understanding Deadweight Loss
Deadweight loss represents the total loss of economic efficiency when market equilibrium is not achieved due to distortions like taxes or price controls. The Harberger triangle specifically visualizes this loss using a triangular area on supply and demand graphs, quantifying the reduction in consumer and producer surplus. Understanding deadweight loss helps measure the unintended consequences of policies that create inefficiencies in resource allocation.
What is the Harberger Triangle?
The Harberger Triangle represents the deadweight loss caused by market inefficiencies such as taxes, subsidies, or price controls, illustrating the reduction in total surplus. It is a graphical depiction of the welfare loss to society, typically shown as a triangular area on supply and demand curves. This concept quantifies how government interventions create allocative inefficiency by preventing mutually beneficial trades.
The Economic Origins of Deadweight Loss
Deadweight loss represents the total loss of economic efficiency due to market distortions, often visualized through the Harberger triangle, which quantifies the welfare loss arising from taxation, subsidies, or monopoly pricing. The economic origins of deadweight loss stem from deviations between marginal social benefits and marginal social costs, leading to underproduction or overconsumption relative to the Pareto optimal allocation. Harberger's analysis mathematically formalized these welfare losses, providing foundational insights into the impact of market interventions on consumer and producer surplus.
Visualizing Deadweight Loss: The Harberger Triangle Explained
The Harberger triangle provides a clear visual representation of deadweight loss resulting from market inefficiencies such as taxes, subsidies, or price controls. This triangular area on a supply and demand graph quantifies the loss of total surplus that neither consumers nor producers gain, illustrating the economic cost of market distortions. By analyzing the Harberger triangle, economists can precisely measure the magnitude of deadweight loss and assess the impact of various policies on overall market efficiency.
Causes of Deadweight Loss in Markets
Deadweight loss arises in markets primarily due to inefficiencies such as taxes, price ceilings, and floors that prevent the equilibrium of supply and demand, leading to reduced total surplus. The Harberger triangle visually represents this loss by illustrating the area between the supply and demand curves where mutually beneficial trades do not occur. Understanding these causes highlights how market distortions reduce economic welfare by deterring optimal production and consumption levels.
Mathematical Representation of the Harberger Triangle
The Harberger triangle represents deadweight loss mathematically as the area of a triangle formed by the difference between supply and demand prices at a given quantity reduction due to taxation or distortion. It is calculated using the formula \( \frac{1}{2} \times \text{tax} \times \text{quantity reduction} \), where the tax distorts the market equilibrium and reduces consumer and producer surplus. This graphical and mathematical approach quantifies inefficiency introduced by market interventions, emphasizing welfare loss beyond tax revenue collected.
Key Differences: Deadweight Loss vs Harberger Triangle
Deadweight loss measures the total loss of economic efficiency due to market distortions such as taxes, subsidies, or price controls, representing the value of trades that no longer occur. The Harberger triangle specifically quantifies deadweight loss as a triangular area on a supply and demand graph, illustrating the lost consumer and producer surplus caused by changes in output and price. Key differences include deadweight loss as a broad concept describing overall inefficiency, while the Harberger triangle is a graphical and quantitative representation used to calculate and visualize that inefficiency.
Real-World Examples of Deadweight Loss
Deadweight loss occurs when market inefficiencies, such as taxes, subsidies, or price controls, cause a loss in total surplus, vividly illustrated by the Harberger triangle that quantifies this inefficiency graphically. Real-world examples include the imposition of excise taxes on tobacco, which reduce consumption but create a deadweight loss by discouraging trades that would have benefited both buyers and sellers. Similarly, rent control policies in cities like New York cause housing supply shortages and inefficiencies, generating a deadweight loss measurable through lost consumer and producer surplus.
Policy Implications: Reducing Deadweight Loss
Reducing deadweight loss, often illustrated by the Harberger triangle, enhances market efficiency by minimizing the welfare loss caused by taxes, subsidies, or price controls. Policymakers aim to design taxes with lower elasticities to shrink the triangle, thereby reducing distortions in supply and demand. Implementing targeted interventions and improving market transparency further align economic incentives, optimizing resource allocation and increasing overall social welfare.
Summary: Harberger Triangle’s Role in Economic Efficiency
The Harberger Triangle quantifies the deadweight loss representing the loss of economic efficiency due to market distortions like taxes or subsidies. This triangle illustrates the reduction in total surplus caused by reduced trade, highlighting inefficiencies introduced in resource allocation. Understanding the Harberger Triangle is crucial for measuring the true cost of interventions and designing policies that minimize deadweight loss.
Deadweight loss Infographic