Average propensity to save measures the proportion of total income that households save rather than spend. It plays a crucial role in understanding consumer behavior and economic health by indicating how much income is diverted from consumption to savings. Explore the rest of the article to learn how your saving habits impact economic growth and financial stability.
Table of Comparison
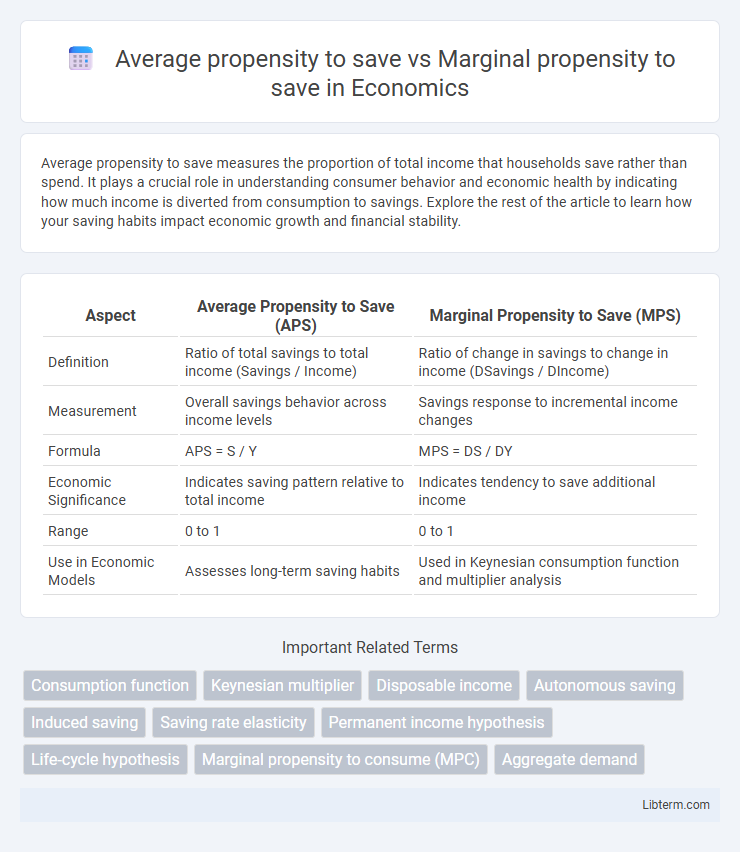
| Aspect | Average Propensity to Save (APS) | Marginal Propensity to Save (MPS) |
|---|---|---|
| Definition | Ratio of total savings to total income (Savings / Income) | Ratio of change in savings to change in income (DSavings / DIncome) |
| Measurement | Overall savings behavior across income levels | Savings response to incremental income changes |
| Formula | APS = S / Y | MPS = DS / DY |
| Economic Significance | Indicates saving pattern relative to total income | Indicates tendency to save additional income |
| Range | 0 to 1 | 0 to 1 |
| Use in Economic Models | Assesses long-term saving habits | Used in Keynesian consumption function and multiplier analysis |
Introduction to Propensity to Save
The average propensity to save (APS) measures the proportion of total income that households save rather than consume, calculated as total savings divided by total income. The marginal propensity to save (MPS) indicates the fraction of an additional unit of income that is saved instead of spent, highlighting changes in saving behavior relative to income fluctuations. Understanding APS and MPS is essential for analyzing consumer saving patterns and assessing the impact of fiscal policies on overall economic savings.
Defining Average Propensity to Save (APS)
Average Propensity to Save (APS) measures the ratio of total savings to total income, indicating the portion of income not spent on consumption. It is calculated by dividing aggregate savings by aggregate disposable income, reflecting overall saving behavior in an economy. APS contrasts with Marginal Propensity to Save (MPS), which represents the fraction of additional income saved rather than spent.
Understanding Marginal Propensity to Save (MPS)
Marginal Propensity to Save (MPS) measures the portion of additional income that a household saves rather than spends, reflecting consumer saving behavior at the margin. It is calculated as the change in saving divided by the change in income, providing insight into how saving patterns adjust with incremental income changes. Unlike the Average Propensity to Save, which shows overall saving as a fraction of total income, MPS captures the sensitivity of saving decisions to income fluctuations, making it crucial for analyzing fiscal policy impacts and consumption trends.
Key Differences: APS vs MPS
Average propensity to save (APS) measures the ratio of total savings to total income, indicating the overall saving behavior at a given income level, whereas marginal propensity to save (MPS) represents the fraction of additional income that is saved rather than spent. APS provides insight into long-term saving patterns across the entire income, while MPS focuses on incremental changes in saving due to a change in income. Understanding the distinction between APS and MPS is crucial for analyzing consumer behavior and designing fiscal policies aimed at influencing saving and spending habits.
Importance of APS and MPS in Economics
Average propensity to save (APS) indicates the ratio of total savings to total income, providing insight into overall saving behavior within an economy, while marginal propensity to save (MPS) measures the portion of additional income saved rather than spent. Both APS and MPS are crucial for understanding consumer saving patterns, informing fiscal policy decisions, and predicting the impact of income changes on aggregate savings and consumption. Policymakers rely on these metrics to design effective economic strategies that stabilize growth and promote financial security.
Factors Influencing APS and MPS
Factors influencing the Average Propensity to Save (APS) include income levels, cultural attitudes towards saving, and economic stability, which determine the overall portion of income saved. Marginal Propensity to Save (MPS) is primarily affected by changes in disposable income, interest rates, and consumer confidence, impacting the fraction of additional income saved. Both APS and MPS vary with fiscal policies and economic cycles, shaping household saving behaviors and influencing aggregate demand.
APS and MPS in Economic Growth
Average Propensity to Save (APS) measures the proportion of total income that households save, reflecting long-term savings behavior crucial for capital accumulation and sustainable economic growth. Marginal Propensity to Save (MPS) indicates the fraction of additional income saved, influencing the multiplier effect and investment levels that drive short-term economic expansion. Higher APS and MPS values enhance the availability of funds for investment, thereby accelerating industrial development and overall economic growth.
Real-World Examples of APS and MPS
The Average Propensity to Save (APS) represents the ratio of total savings to total income, commonly observed in households during economic stability, such as American families saving 7-8% of their annual income. In contrast, the Marginal Propensity to Save (MPS) reflects the change in savings resulting from a change in income, exemplified by low-income workers in developing countries who tend to save a smaller fraction of any additional income due to immediate consumption needs. Real-world data from OECD countries shows APS varies widely, while MPS influences fiscal policy effectiveness by determining how much additional income is saved rather than spent.
Policy Implications: APS vs MPS
Average Propensity to Save (APS) reflects the overall saving behavior by measuring the ratio of total savings to total income, influencing long-term fiscal policies aimed at boosting national savings rates. Marginal Propensity to Save (MPS) indicates the proportion of additional income saved, critical for designing short-term stimulus policies targeting consumption and investment balances. Policymakers use APS to evaluate sustainable savings trends, while MPS helps estimate the effectiveness of fiscal interventions on aggregate demand and economic growth.
Conclusion: The Role of Propensity to Save
Average propensity to save (APS) measures the proportion of total income saved, while marginal propensity to save (MPS) reflects the saving rate out of additional income. Both APS and MPS play crucial roles in understanding consumer behavior, influencing economic models and fiscal policies. High APS indicates strong overall saving habits, whereas high MPS suggests increased saving with income growth, affecting investment and economic stability.
Average propensity to save Infographic