Market-to-Book Ratio measures a company's market value relative to its book value, highlighting investor sentiment about its growth potential. This ratio helps You assess whether a stock is undervalued or overvalued by comparing market capitalization to net asset value. Explore the full article to understand how to effectively use Market-to-Book Ratio in your investment decisions.
Table of Comparison
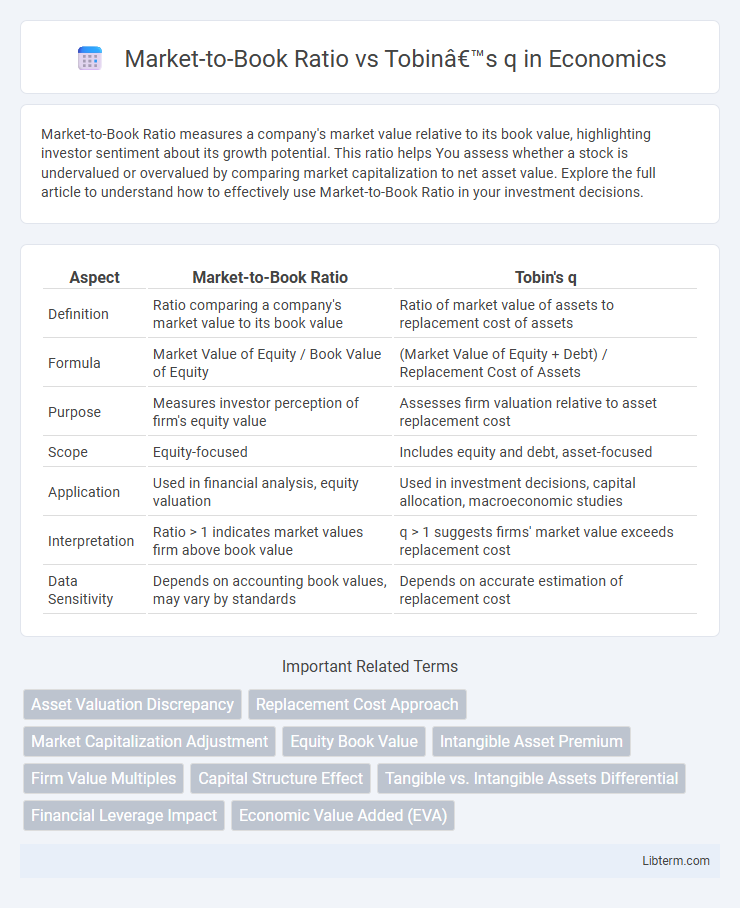
| Aspect | Market-to-Book Ratio | Tobin's q |
|---|---|---|
| Definition | Ratio comparing a company's market value to its book value | Ratio of market value of assets to replacement cost of assets |
| Formula | Market Value of Equity / Book Value of Equity | (Market Value of Equity + Debt) / Replacement Cost of Assets |
| Purpose | Measures investor perception of firm's equity value | Assesses firm valuation relative to asset replacement cost |
| Scope | Equity-focused | Includes equity and debt, asset-focused |
| Application | Used in financial analysis, equity valuation | Used in investment decisions, capital allocation, macroeconomic studies |
| Interpretation | Ratio > 1 indicates market values firm above book value | q > 1 suggests firms' market value exceeds replacement cost |
| Data Sensitivity | Depends on accounting book values, may vary by standards | Depends on accurate estimation of replacement cost |
Introduction to Market-to-Book Ratio and Tobin’s q
Market-to-Book Ratio measures a company's market value relative to its book value, indicating how investors value its equity compared to accounting metrics. Tobin's q compares a firm's market value to the replacement cost of its assets, reflecting the market's assessment of the firm's growth opportunities and efficiency. Both ratios serve as key indicators in corporate finance and investment analysis, capturing different dimensions of firm valuation.
Defining the Market-to-Book Ratio
The Market-to-Book Ratio measures a company's market value relative to its book value, calculated by dividing market capitalization by total book equity. It reflects investor sentiment on future growth prospects and asset profitability. Unlike Tobin's q, which compares market value to asset replacement costs, the Market-to-Book Ratio uses accounting-based book values as the denominator.
Understanding Tobin’s q Ratio
Tobin's q ratio compares a firm's market value to the replacement cost of its assets, reflecting investment attractiveness and growth potential. It is calculated by dividing the market value of a company's assets by their replacement cost, providing insights into whether a company's stock is undervalued or overvalued relative to its physical assets. Unlike the Market-to-Book Ratio, which only compares market value to accounting book value, Tobin's q incorporates asset replacement cost, offering a more comprehensive measure of firm valuation and investment incentives.
Key Formulae: How to Calculate Each Ratio
The Market-to-Book Ratio is calculated by dividing a company's market capitalization by its book value, expressed as Market-to-Book Ratio = Market Value of Equity / Book Value of Equity. Tobin's q is determined by dividing the market value of a firm's assets by the replacement cost of those assets, formulated as Tobin's q = Market Value of Firm / Replacement Cost of Assets. Both ratios assess firm valuation but differ in incorporating market value relative to book value and asset replacement cost, respectively.
Main Differences Between Market-to-Book Ratio and Tobin’s q
The Market-to-Book Ratio compares a company's market value to its book value, reflecting how investors value equity relative to accounting figures, while Tobin's q measures the market value of a company's assets divided by their replacement cost, emphasizing asset replacement efficiency. Unlike the Market-to-Book Ratio, Tobin's q includes both equity and debt in its calculation, offering a broader assessment of firm valuation and investment potential. The Market-to-Book Ratio is widely used in equity analysis, whereas Tobin's q is favored in economic studies assessing capital allocation and investment behavior.
Data Sources and Input Requirements
The Market-to-Book Ratio relies on readily available financial statement data such as market capitalization and book value of equity, facilitating straightforward calculation using stock market prices and company balance sheets. Tobin's q requires more complex inputs including the market value of assets, replacement cost of assets, and detailed firm-level investment data, often sourced from specialized databases and economic reports. Accurate estimation of Tobin's q depends on comprehensive asset valuation metrics, whereas Market-to-Book Ratio emphasizes standard market and accounting figures.
Practical Applications in Financial Analysis
Market-to-Book Ratio measures a company's market value relative to its book value, providing insights into investor sentiment and asset valuation efficiency. Tobin's q compares the market value of a firm's assets to their replacement cost, offering a dynamic perspective on investment attractiveness and capital allocation decisions. In practical financial analysis, Market-to-Book Ratio aids in identifying undervalued or overvalued stocks, while Tobin's q is essential for assessing firms' growth potential and economic profitability in capital budgeting.
Strengths and Limitations of Each Metric
The Market-to-Book Ratio excels in simplicity and accessibility, providing a straightforward comparison of a company's market value to its book value, but it may overlook intangible assets and market sentiment that distort true value. Tobin's q offers a more comprehensive assessment by comparing market value to replacement cost of assets, effectively capturing economic conditions and investment opportunities, yet its reliance on approximation of replacement costs can introduce measurement errors. Each metric serves distinct purposes: Market-to-Book is ideal for quick valuation benchmarks, while Tobin's q better informs capital allocation decisions and long-term growth potential analysis.
Case Studies: Real-World Examples
The Market-to-Book Ratio often appears in case studies evaluating firm valuation, highlighting discrepancies between market perception and accounting values, as seen in tech giants like Apple, where high ratios indicate strong growth expectations. Tobin's q, used in cases such as General Electric, measures asset replacement cost against market value, revealing investment efficiency and potential overvaluation or undervaluation. Real-world applications demonstrate how these metrics guide investment decisions, capital allocation, and corporate strategy across different industries.
Conclusion: Choosing the Right Ratio for Valuation
Market-to-Book Ratio offers a straightforward assessment of a company's market value relative to its accounting book value, making it useful for quick comparisons in asset-intensive industries. Tobin's q provides a broader economic perspective by comparing market value to replacement cost of assets, capturing intangible factors like growth potential and market conditions. Selecting between these ratios depends on industry context and valuation goals; Market-to-Book suits firms with stable asset bases, while Tobin's q is preferred for companies with significant intangible assets or dynamic market environments.
Market-to-Book Ratio Infographic