A Nichols plot is a powerful tool in control engineering for analyzing the frequency response of a system by plotting the open-loop gain against the phase angle. This graphical representation helps engineers assess system stability and design appropriate compensators to meet performance requirements. Explore the rest of this article to understand how a Nichols plot can enhance your control system design process.
Table of Comparison
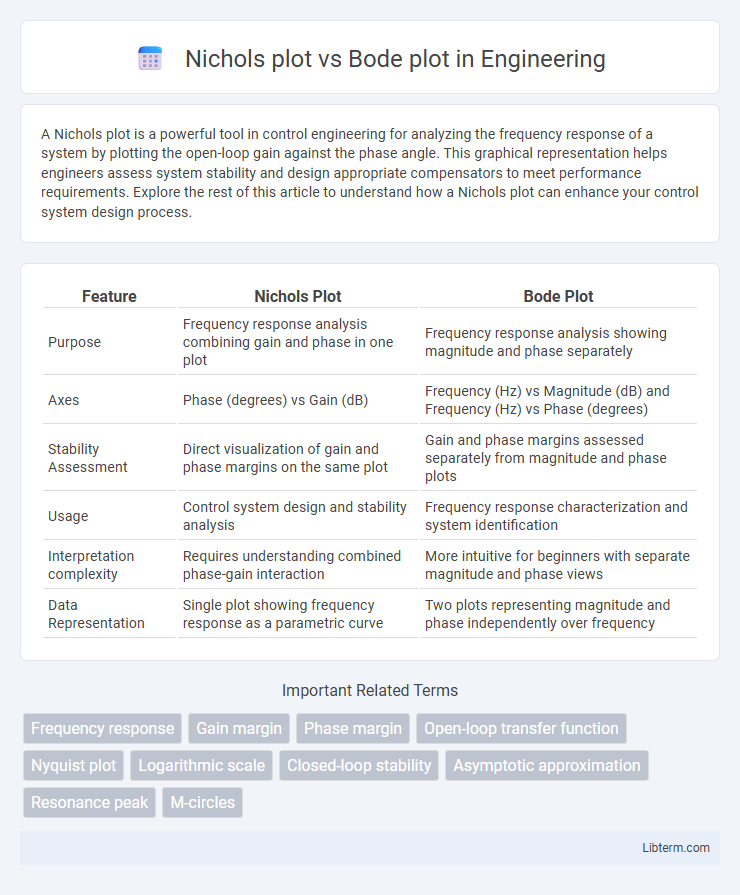
| Feature | Nichols Plot | Bode Plot |
|---|---|---|
| Purpose | Frequency response analysis combining gain and phase in one plot | Frequency response analysis showing magnitude and phase separately |
| Axes | Phase (degrees) vs Gain (dB) | Frequency (Hz) vs Magnitude (dB) and Frequency (Hz) vs Phase (degrees) |
| Stability Assessment | Direct visualization of gain and phase margins on the same plot | Gain and phase margins assessed separately from magnitude and phase plots |
| Usage | Control system design and stability analysis | Frequency response characterization and system identification |
| Interpretation complexity | Requires understanding combined phase-gain interaction | More intuitive for beginners with separate magnitude and phase views |
| Data Representation | Single plot showing frequency response as a parametric curve | Two plots representing magnitude and phase independently over frequency |
Introduction to Nichols Plot and Bode Plot
Nichols plot and Bode plot are essential tools in control system analysis, providing frequency response characteristics of a system. Nichols plot represents the open-loop frequency response by plotting gain (in dB) versus phase (in degrees) on a single chart, facilitating stability margin assessments directly. Bode plot displays magnitude and phase separately as functions of frequency, enabling easier visualization of system behavior and design of compensators based on gain crossover and phase margin.
Definition and Purpose of Nichols Plot
Nichols plot displays the frequency response of a control system by plotting gain (magnitude) in decibels against phase in degrees, enabling direct assessment of stability margins and robustness. Unlike Bode plots, which separately show gain and phase versus frequency, Nichols plots combine these parameters into a single graph for more intuitive stability analysis and controller tuning. The primary purpose of Nichols plots is to facilitate design and evaluation of feedback control systems by visualizing gain and phase simultaneously to ensure adequate stability and performance.
Overview of Bode Plot in Control Systems
Bode plots graphically represent a system's frequency response by displaying magnitude and phase versus frequency on logarithmic scales, providing clear insights into stability margins and resonance characteristics. They are essential in control systems for analyzing gain crossover frequency and phase margin, which help predict system behavior in the frequency domain. Unlike Nichols plots, which combine gain and phase into a single curve, Bode plots offer separate detailed views, making them widely used for designing and tuning controllers.
Key Differences Between Nichols and Bode Plots
Nichols plots display the open-loop frequency response as a plot of gain (in dB) versus phase (in degrees) on the same graph, allowing direct assessment of gain and phase margins simultaneously, whereas Bode plots separate the magnitude and phase into two separate graphs versus frequency. Nichols plots emphasize closed-loop stability margins and gain-phase interactions by overlaying constant closed-loop gain contours, while Bode plots provide a clearer frequency-domain perspective on system amplitude and phase behavior. Control engineers use Nichols plots for robust stability analysis in feedback design, whereas Bode plots excel in intuitive frequency response characterization and filter design.
How to Construct a Nichols Plot
To construct a Nichols plot, begin by calculating the open-loop frequency response of the system, specifically the gain and phase of the transfer function across a range of frequencies. Plot the phase shift on the horizontal axis and gain (in decibels) on the vertical axis, mapping these values as points corresponding to each frequency. This graphical representation directly relates to the Bode plot by plotting gain versus phase instead of frequency, providing a valuable tool for assessing stability and designing control systems.
Step-by-Step Bode Plot Construction
Bode plot construction involves plotting magnitude and phase of a system's frequency response on logarithmic scales to analyze stability and frequency characteristics. The step-by-step process includes calculating the gain and phase of the open-loop transfer function at various frequencies, converting these values into decibels and degrees, and then plotting these points to form the magnitude and phase curves. This approach contrasts with the Nichols plot, which directly displays gain versus phase, facilitating feedback stability assessment by combining these parameters into a single graph.
Applications of Nichols Plot in Engineering
Nichols plots provide a comprehensive frequency response analysis by displaying gain and phase simultaneously, making them essential in control system design for assessing stability margins and robustness. Engineers use Nichols plots to fine-tune feedback controllers, optimize phase and gain margins, and predict system behavior under varying conditions with greater precision than Bode plots. These plots are especially valuable in aerospace, robotics, and automotive control systems where precise stability analysis and performance tuning are critical.
Bode Plot Applications in Frequency Analysis
Bode plots are fundamental in frequency analysis for designing and analyzing control systems by displaying gain and phase across a range of frequencies, allowing engineers to assess system stability and performance. These plots facilitate the identification of bandwidth, resonant frequencies, and margins, critical for optimizing compensator design and ensuring robustness against disturbances. Unlike Nichols plots, which combine gain and phase on a single plot, Bode plots offer clearer, separate visualizations of magnitude and phase, simplifying interpretation in frequency response evaluation.
Advantages and Limitations of Nichols Plot vs Bode Plot
Nichols plots provide a combined representation of gain and phase margins on a single graph, enabling precise stability analysis and robust controller design, whereas Bode plots separately display magnitude and phase, which may require cross-referencing for stability assessment. Nichols plots excel in handling open-loop frequency response data directly for control synthesis, but can be less intuitive for beginners compared to the more widely used Bode plots that offer clear visualization of gain and phase trends across frequencies. Despite Bode plots' ease of interpretation and widespread use, Nichols plots offer superior insight into closed-loop system behavior and gain-phase interaction, which is critical for advanced control design and robustness evaluation.
Choosing the Right Plot: Nichols vs Bode in Practice
Nichols plots offer a combined view of gain and phase margins, making them ideal for assessing stability margins in control systems, while Bode plots separately display magnitude and phase versus frequency for detailed frequency response analysis. Engineers often choose Nichols plots when tuning controllers to quickly visualize gain and phase interactions, whereas Bode plots excel in identifying specific resonant frequencies and bandwidth. Practical applications dictate selecting Nichols plots for robust control design and Bode plots for comprehensive frequency response characterization.
Nichols plot Infographic