Ladder diagrams are essential tools in industrial automation, representing electrical control circuits in a user-friendly graphical format that resembles a ladder. They simplify troubleshooting and program design for programmable logic controllers (PLCs), making complex control systems easier to understand. Discover how mastering ladder diagrams can enhance your automation projects by reading the full article.
Table of Comparison
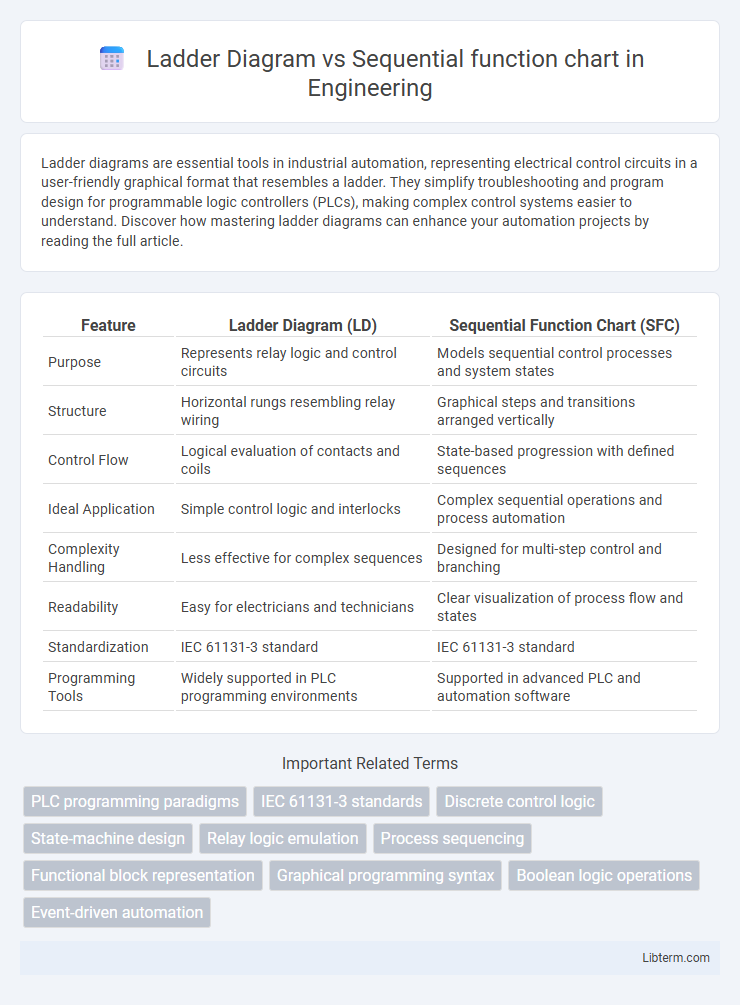
| Feature | Ladder Diagram (LD) | Sequential Function Chart (SFC) |
|---|---|---|
| Purpose | Represents relay logic and control circuits | Models sequential control processes and system states |
| Structure | Horizontal rungs resembling relay wiring | Graphical steps and transitions arranged vertically |
| Control Flow | Logical evaluation of contacts and coils | State-based progression with defined sequences |
| Ideal Application | Simple control logic and interlocks | Complex sequential operations and process automation |
| Complexity Handling | Less effective for complex sequences | Designed for multi-step control and branching |
| Readability | Easy for electricians and technicians | Clear visualization of process flow and states |
| Standardization | IEC 61131-3 standard | IEC 61131-3 standard |
| Programming Tools | Widely supported in PLC programming environments | Supported in advanced PLC and automation software |
Introduction to Ladder Diagrams and Sequential Function Charts
Ladder Diagrams (LD) are graphical representations used in programmable logic controllers (PLCs) that resemble electrical relay logic, making them intuitive for electricians and engineers to design control circuits. Sequential Function Charts (SFC) provide a structured approach to modeling sequential operations by breaking processes into steps and transitions, enhancing clarity in complex automation tasks. Both tools play crucial roles in industrial automation, with Ladder Diagrams excelling in straightforward control logic and Sequential Function Charts being preferred for managing complex sequences and state-driven processes.
Fundamental Principles of Ladder Diagrams
Ladder diagrams use relay logic representation with vertical rails and horizontal rungs to visually depict control circuits, making them intuitive for illustrating binary operations in automation. Each rung represents a logical operation, combining input contacts and output coils to control machinery based on specific conditions. Unlike sequential function charts, ladder diagrams emphasize real-time decision-making through discrete on/off states, which relate directly to the physical wiring and relay logic principles.
Key Features of Sequential Function Charts
Sequential Function Charts (SFC) provide a graphical programming language designed to represent control sequences through steps, transitions, and actions, enabling clear visualization of complex process flows in industrial automation. Key features include the ability to handle parallel processes with simultaneous step execution, support for modular programming with structured segments, and explicit state-based control for enhanced process reliability and maintainability. SFCs facilitate improved debugging and monitoring due to their stepwise execution and clear transition conditions, distinguishing them from the linear and often simpler representation found in Ladder Diagrams.
Visual Structure and Readability Comparison
Ladder Diagrams utilize a straightforward, electrical circuit-like visual structure with parallel rungs, enhancing readability for technicians familiar with relay logic by clearly showing input-output relationships. Sequential Function Charts (SFC) feature a modular, step-transition structure that visually breaks down process sequences into discrete steps and transitions, improving clarity for complex control scenarios. The choice between them depends on the complexity and nature of the process, with Ladder Diagrams favoring simplicity and SFCs excelling in representing sequential logic flows.
Programming Logic and Workflow Differences
Ladder Diagram (LD) uses relay logic symbols to represent electrical control circuits, making it intuitive for programming simple on/off control and discrete sequences. Sequential Function Chart (SFC) provides a graphical flowchart-like representation of steps and transitions, enabling complex process control with clear state management and parallel operations. LD emphasizes contact and coil logic for straightforward operations, whereas SFC excels in modeling sequencing logic and concurrent workflows, enhancing clarity in complex automation tasks.
Advantages of Ladder Diagrams in Industrial Automation
Ladder Diagrams offer straightforward visualization closely resembling electrical relay logic, making them highly accessible for technicians and engineers in industrial automation. Their simplicity facilitates quick debugging and modification of control circuits, reducing downtime and maintenance costs. Compatibility with a wide range of programmable logic controllers (PLCs) ensures seamless integration in various automation applications, enhancing operational efficiency.
Benefits of Using Sequential Function Charts
Sequential Function Charts (SFC) offer clear visualization of complex process sequences, enhancing the understanding and troubleshooting of automation workflows. SFCs support modular design and reuse of code, which improves maintainability and scalability in control systems. Their ability to represent parallel and conditional operations simplifies programming compared to Ladder Diagrams, making them ideal for advanced industrial applications.
Application Areas: When to Use Each Method
Ladder Diagrams are best suited for simple control systems such as motor starters, relays, and basic on/off control in manufacturing and automotive industries. Sequential Function Charts excel in complex automation processes requiring clear visualization of sequences, like batch processing in chemical plants or multi-step assembly lines in electronics manufacturing. Choosing between them depends on the complexity and clarity needed in programming control sequences.
Conversion and Integration Between Both Techniques
Ladder Diagram (LD) and Sequential Function Chart (SFC) are widely used programming languages in industrial automation, with LD being more straightforward for relay logic and SFC excelling in modeling complex sequences. Conversion from LD to SFC involves restructuring ladder logic into sequential steps and transitions, enhancing readability and modular troubleshooting within complex processes. Integration between LD and SFC enables hybrid control systems, where LD manages simple control tasks and SFC handles high-level sequencing, improving system flexibility and maintainability.
Conclusion: Choosing the Right PLC Programming Method
Ladder Diagram (LD) offers simplicity and ease of use for straightforward control systems, making it ideal for beginners and basic automation tasks. Sequential Function Chart (SFC) excels in complex, step-based process control by clearly visualizing sequence flow and state transitions. Selecting the appropriate PLC programming method depends on the application's complexity, with LD suiting simple discrete control and SFC preferred for sequential and batch processes.
Ladder Diagram Infographic