Variance measures the dispersion of data points around the mean, indicating the degree of spread in a dataset. It plays a crucial role in statistics, risk assessment, and data analysis by quantifying variability and helping you understand the consistency of results. Explore the rest of the article to learn how variance impacts decision-making and statistical interpretations.
Table of Comparison
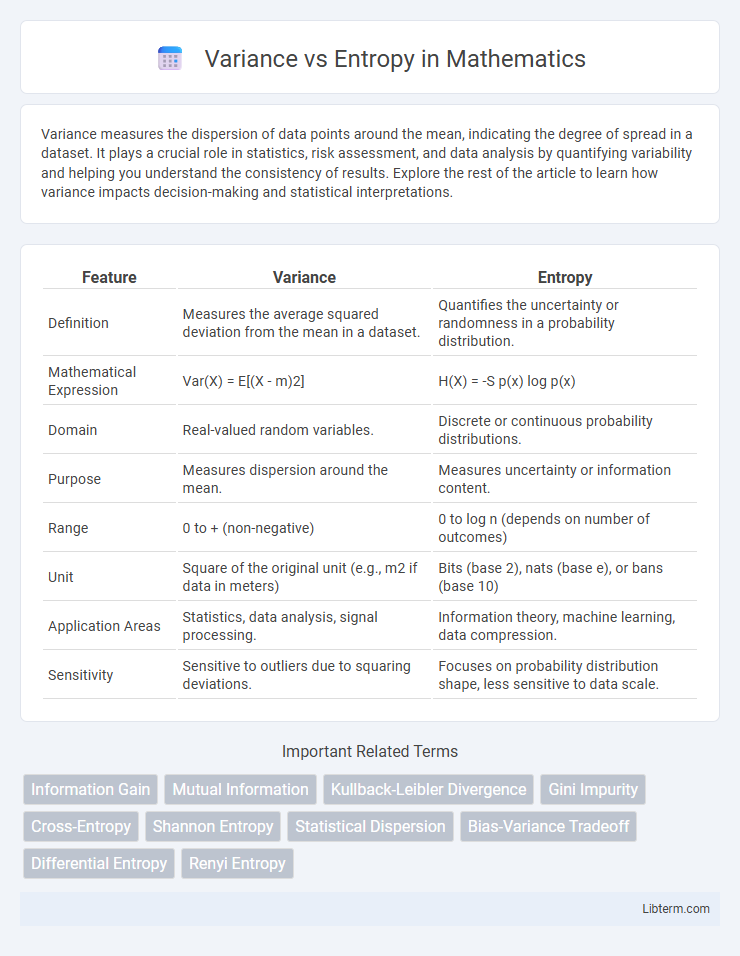
| Feature | Variance | Entropy |
|---|---|---|
| Definition | Measures the average squared deviation from the mean in a dataset. | Quantifies the uncertainty or randomness in a probability distribution. |
| Mathematical Expression | Var(X) = E[(X - m)2] | H(X) = -S p(x) log p(x) |
| Domain | Real-valued random variables. | Discrete or continuous probability distributions. |
| Purpose | Measures dispersion around the mean. | Measures uncertainty or information content. |
| Range | 0 to + (non-negative) | 0 to log n (depends on number of outcomes) |
| Unit | Square of the original unit (e.g., m2 if data in meters) | Bits (base 2), nats (base e), or bans (base 10) |
| Application Areas | Statistics, data analysis, signal processing. | Information theory, machine learning, data compression. |
| Sensitivity | Sensitive to outliers due to squaring deviations. | Focuses on probability distribution shape, less sensitive to data scale. |
Introduction to Variance and Entropy
Variance measures the dispersion of a dataset by calculating the average squared deviation from the mean, quantifying the spread of numerical values. Entropy represents the uncertainty or randomness in a data distribution, often used in information theory to evaluate the unpredictability of a system. Both metrics serve as fundamental tools in statistics and machine learning for analyzing data variability and information content.
Defining Variance: Concept and Calculation
Variance measures the average squared deviation of a dataset's values from the mean, reflecting data dispersion. It is calculated by summing the squared differences between each value and the mean, then dividing by the number of observations. Variance is a key concept in statistics for understanding variability within numerical datasets.
Understanding Entropy: Meaning and Measurement
Entropy quantifies the unpredictability or disorder within a dataset, measuring the average level of information or uncertainty present. In information theory, entropy is calculated using the probability distribution of different outcomes, with higher entropy indicating greater randomness and less predictability. Unlike variance, which measures the spread of numerical values around a mean, entropy captures the notion of uncertainty in categorical or probabilistic contexts.
Variance vs Entropy: Core Differences
Variance measures the spread of numerical data around the mean by calculating the average squared deviations, serving as a key metric in continuous variable analysis. Entropy quantifies the uncertainty or randomness in a probability distribution, primarily used in information theory and classification tasks to evaluate impurity or disorder. The core difference lies in variance assessing numerical variability, while entropy captures probabilistic uncertainty in discrete or categorical data.
Applications of Variance in Data Analysis
Variance quantifies the spread of numerical data by measuring the average squared deviation from the mean, making it crucial for identifying data dispersion and consistency in datasets. It is widely applied in regression analysis, portfolio optimization, and quality control to assess risk, detect outliers, and improve predictive accuracy. By providing insights into variability, variance supports feature selection and clustering algorithms, enhancing the interpretability and reliability of data-driven models.
Role of Entropy in Information Theory
Entropy quantifies the uncertainty or randomness in a data source, serving as a fundamental measure in information theory for predicting the average minimum number of bits needed to encode messages. Unlike variance, which measures the dispersion of numerical values around a mean, entropy captures the unpredictability in symbolic data distributions. Entropy's role is crucial in optimizing data compression and error correction by evaluating the information content and guiding efficient coding schemes.
Variance and Entropy in Machine Learning
Variance measures the spread of data points around the mean, quantifying model prediction fluctuations and indicating overfitting risks in machine learning. Entropy evaluates the uncertainty or impurity within a dataset, commonly used in decision tree algorithms to determine the best feature splits by maximizing information gain. Both variance and entropy are essential metrics for optimizing model accuracy and robustness in classification and regression tasks.
Practical Examples: Comparing Variance and Entropy
Variance measures the spread of numerical data around the mean, commonly used in regression analysis and portfolio risk assessment. Entropy quantifies uncertainty or disorder, frequently applied in decision tree algorithms for classification tasks. For instance, variance helps evaluate stock price volatility, while entropy optimizes splits in customer segmentation models.
Pros and Cons: Variance versus Entropy
Variance effectively measures the spread of numerical data, providing a direct quantification of data dispersion but becomes less informative for categorical variables. Entropy gauges the unpredictability or disorder within a dataset, making it ideal for classification tasks and handling categorical attributes, yet it can be computationally intensive. While variance excels in regression contexts by emphasizing magnitude differences, entropy better captures the purity of splits in decision trees, each with trade-offs in interpretability and application scope.
Conclusion: When to Use Variance or Entropy
Variance is ideal for measuring the spread or dispersion of continuous data, making it suitable for regression tasks and situations where numerical stability is essential. Entropy excels in classification problems by quantifying uncertainty or impurity within categorical distributions, thus guiding decisions in decision tree algorithms. Choose variance for numerical prediction accuracy and entropy for optimizing splits in categorical data classification.
Variance Infographic