Exponential growth describes a process where quantities increase rapidly at a consistent rate over time, resulting in dramatic escalation. This concept is fundamental in fields like finance, technology, and population studies, helping predict future trends based on current data. Explore the rest of the article to understand how exponential principles affect your everyday decisions and long-term planning.
Table of Comparison
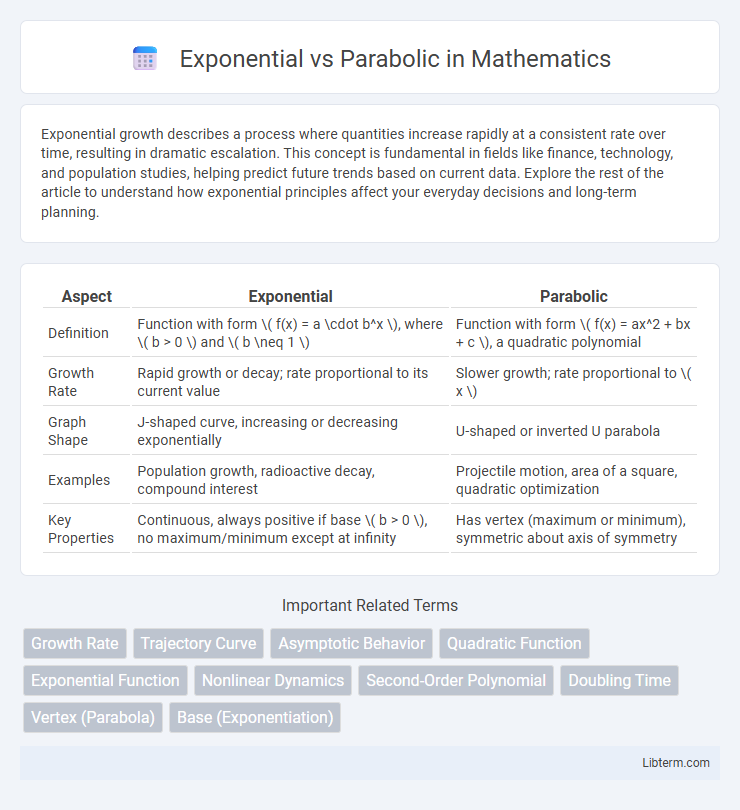
| Aspect | Exponential | Parabolic |
|---|---|---|
| Definition | Function with form \( f(x) = a \cdot b^x \), where \( b > 0 \) and \( b \neq 1 \) | Function with form \( f(x) = ax^2 + bx + c \), a quadratic polynomial |
| Growth Rate | Rapid growth or decay; rate proportional to its current value | Slower growth; rate proportional to \( x \) |
| Graph Shape | J-shaped curve, increasing or decreasing exponentially | U-shaped or inverted U parabola |
| Examples | Population growth, radioactive decay, compound interest | Projectile motion, area of a square, quadratic optimization |
| Key Properties | Continuous, always positive if base \( b > 0 \), no maximum/minimum except at infinity | Has vertex (maximum or minimum), symmetric about axis of symmetry |
Introduction to Exponential and Parabolic Models
Exponential and parabolic models are fundamental in describing growth and change patterns across various scientific disciplines. Exponential models depict processes with constant relative growth rates, leading to rapid increases or decreases, commonly observed in population dynamics and radioactive decay. Parabolic models, represented by quadratic functions, capture relationships where change occurs at varying rates, often used to describe projectile motion or the path of objects under uniform acceleration.
Defining Exponential Growth and Decay
Exponential growth describes a process where the quantity increases at a rate proportional to its current value, leading to rapid escalation, often modeled by the equation \( N(t) = N_0 e^{rt} \), where \( r \) is the growth rate. Exponential decay occurs when the quantity decreases at a rate proportional to its current value, characterized by the same equation with a negative growth rate \( r \), resulting in a gradual decline towards zero. In contrast, parabolic growth or decay follows a polynomial rate change, typically quadratic, and does not exhibit the multiplicative rate change seen in exponential functions.
Understanding Parabolic Functions
Parabolic functions are quadratic equations defined by the form f(x) = ax2 + bx + c, where their graph forms a symmetrical curve called a parabola. Key properties include vertex location, axis of symmetry, and the direction of opening, determined by the coefficient a. Understanding parabolic functions involves analyzing their vertex, roots (x-intercepts), and the effects of varying coefficients on the graph's shape and position.
Mathematical Representations: Equations and Graphs
Exponential functions are represented by equations of the form \( y = ab^x \), where \( a \) is the initial value and \( b \) is the growth or decay base, producing graphs characterized by rapid increases or decreases that never cross the x-axis. Parabolic functions follow quadratic equations \( y = ax^2 + bx + c \), where \( a \neq 0 \), generating symmetric U-shaped graphs called parabolas with a vertex representing the maximum or minimum point. Exponential graphs exhibit continuous growth or decay curves, while parabolic graphs display a curved path that opens upward or downward depending on the sign of \( a \).
Key Differences: Rate of Change
Exponential functions exhibit a constant relative rate of change, where the output grows or decays by a fixed percentage over equal intervals, resulting in rapid acceleration or decay as the input increases. Parabolic functions, defined by quadratic equations, have a variable rate of change that increases or decreases linearly, producing a symmetric curve with a constant second derivative. The key difference lies in exponential growth involving multiplicative increases, while parabolic growth involves additive changes in the rate of change.
Real-world Applications of Exponential Models
Exponential models are widely used in real-world applications such as population growth, radioactive decay, and compound interest calculations due to their ability to represent continuous, rapid change proportional to the current value. These models are crucial in epidemiology for modeling the spread of infectious diseases, where the number of cases increases exponentially over time. In contrast to parabolic models, which describe quadratic relationships often seen in projectile motion and area calculations, exponential models capture dynamic processes involving multiplicative growth or decay.
Practical Uses of Parabolic Curves
Parabolic curves are commonly used in satellite dishes and automobile headlights to focus signals and light beams efficiently, leveraging their unique reflective properties. In construction and engineering, parabolic arches provide strong structural support while distributing weight evenly, making them ideal for bridges and tunnels. Their predictable geometric shape also enables precise modeling in projectile motion for ballistics and sports science.
Visualization: Comparing Graphical Shapes
Exponential graphs display a rapid increase or decrease, forming a J-shaped curve that rises steeply or falls sharply, visually representing exponential growth or decay. Parabolic graphs, defined by quadratic functions, exhibit a symmetric U-shaped curve opening upwards or downwards, indicating a constant rate of change in slope. The stark contrast in curvature between exponential and parabolic graphs helps distinguish their unique mathematical properties and real-world applications.
Common Misconceptions and Mistakes
Exponential growth increases at a rate proportional to its current value, leading to rapid escalation, while parabolic growth follows a quadratic pattern, characterized by a constant second derivative and symmetrical curvature. A common misconception is confusing exponential functions with parabolic ones, often misinterpreting exponential growth as linear or polynomial growth due to slow initial increase. Mistakes also arise in modeling scenarios by incorrectly applying parabolic equations to phenomena that inherently exhibit exponential growth, such as population dynamics or compound interest calculations.
Choosing the Right Model for Your Data
Selecting the appropriate model for your data hinges on recognizing growth patterns: exponential models suit data with constant proportional growth rates, exemplified by viral population increases or compound interest. Parabolic models fit scenarios where growth accelerates or decelerates at a changing rate, as seen in projectile motion or quadratic revenue functions. Analyzing residuals and goodness-of-fit metrics like R-squared and Akaike Information Criterion guides the optimal choice between exponential and parabolic models for accurate forecasting and interpretation.
Exponential Infographic