A quadrant divides a plane into four distinct sections, each representing a unique combination of positive or negative values along two axes. This concept is widely used in mathematics, data analysis, and strategic frameworks to categorize information or data points for clearer insight. Explore the rest of the article to see how quadrants can be applied to enhance your understanding and decision-making.
Table of Comparison
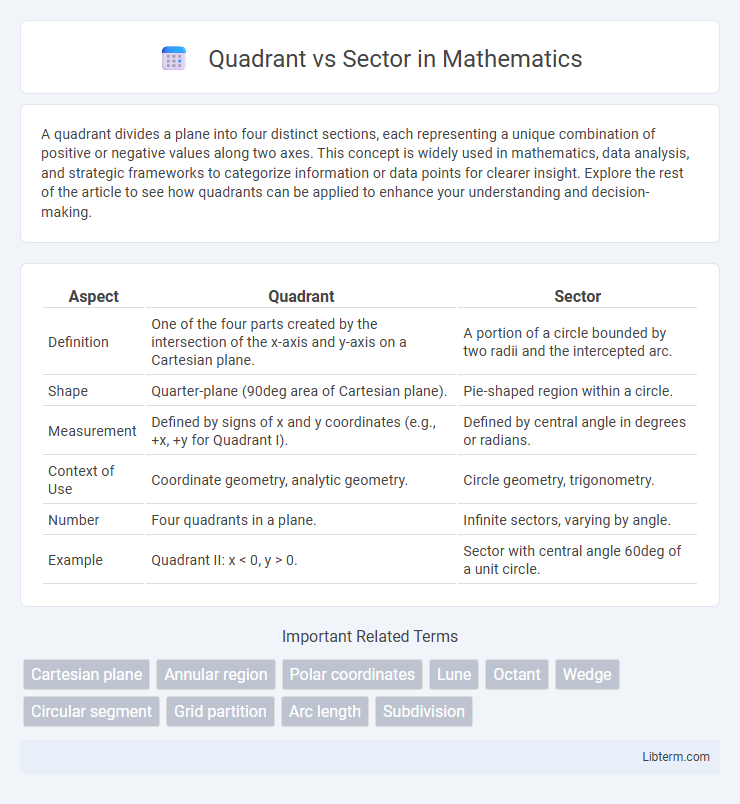
| Aspect | Quadrant | Sector |
|---|---|---|
| Definition | One of the four parts created by the intersection of the x-axis and y-axis on a Cartesian plane. | A portion of a circle bounded by two radii and the intercepted arc. |
| Shape | Quarter-plane (90deg area of Cartesian plane). | Pie-shaped region within a circle. |
| Measurement | Defined by signs of x and y coordinates (e.g., +x, +y for Quadrant I). | Defined by central angle in degrees or radians. |
| Context of Use | Coordinate geometry, analytic geometry. | Circle geometry, trigonometry. |
| Number | Four quadrants in a plane. | Infinite sectors, varying by angle. |
| Example | Quadrant II: x < 0, y > 0. | Sector with central angle 60deg of a unit circle. |
Introduction to Quadrant and Sector
A quadrant is one of four equal sections created by two perpendicular axes dividing a Cartesian plane, used to locate points or analyze data in coordinate geometry. A sector is a portion of a circle bounded by two radii and the connecting arc, frequently used to represent data in pie charts or measure angles within circles. While quadrants organize planar data into four distinct regions, sectors segment circular areas based on radius angles or proportional values.
Definition of Quadrant
A quadrant is a quarter of a plane divided by two perpendicular axes, commonly used in Cartesian coordinate systems to locate points. Sectors, on the other hand, represent portions of a circle bounded by two radii and an arc. Understanding quadrants is essential for graphing and analyzing data within specific regions of XY planes.
Definition of Sector
A sector is a distinct geometric region defined by two radii and the arc between them, representing a portion of a circle. Unlike a quadrant, which is exactly one-fourth of a circle or 90 degrees, a sector can vary in size and angle, covering any fraction of the circle's circumference. Sectors are commonly used in fields such as geometry, trigonometry, and data visualization to illustrate proportional relationships within circular shapes.
Key Differences Between Quadrant and Sector
A quadrant divides a plane into four equal parts based on two perpendicular axes, often used to analyze data or spatial relationships, whereas a sector represents a portion of a circle bounded by two radii and the arc between them, commonly used in geometry and circular charts. Quadrants emphasize positional or categorical distinction along x and y axes, while sectors focus on angular measurement or proportional representation in a circular context. Understanding these differences is crucial for selecting the appropriate method in data visualization, spatial analysis, and geometric applications.
Applications of Quadrants in Mathematics
Quadrants in mathematics are essential for identifying the position of points on the Cartesian coordinate plane, dividing it into four distinct areas based on the signs of x and y coordinates. This division facilitates graphing functions, analyzing geometric shapes, and solving inequalities by clearly categorizing coordinate pairs. Quadrants also play a crucial role in trigonometry, vector analysis, and complex number representation, allowing precise interpretation of angle measures and magnitudes across different regions of the plane.
Applications of Sectors in Geometry
Sectors in geometry are widely applied in fields such as engineering, architecture, and computer graphics for calculating areas and designing curved structures. Their ability to represent portions of circles makes sectors essential in modeling pie charts, circular segments, and arcs in mechanical parts. Understanding sector properties allows precise measurements in angle-based calculations critical for navigation and robotics.
Visual Representation: Quadrant vs Sector
Quadrants divide a Cartesian plane into four equal parts using perpendicular axes, creating distinct visual areas for comparative analysis across two variables. Sectors, also known as pie chart slices, represent proportional parts of a whole as segments of a circular graph, emphasizing percentage-based relationships. The visual distinction lies in quadrants' grid structure facilitating intersectional data interpretation, while sectors provide intuitive insight into distribution and composition.
Common Misconceptions
Quadrant and sector are often confused in geometric contexts; a quadrant refers to one of the four equal parts created by the intersection of two perpendicular axes, specifically covering a 90-degree angle, while a sector is a portion of a circle bounded by two radii and the connecting arc, which can have any angle less than 360 degrees. Common misconceptions include assuming a quadrant is always part of a circle, but geometric quadrants apply to coordinate planes, not circular areas. Understanding the distinct definitions prevents errors in interpreting graphs and solving spatial problems accurately.
Quadrants and Sectors in Real-Life Scenarios
Quadrants and sectors are often used in real-life scenarios to organize and analyze spatial data efficiently; quadrants divide a plane into four equal parts, while sectors are defined by dividing a circle into equal angular portions. In urban planning, quadrants help map city zones for resource allocation, whereas sectors guide the design of circular parks or roundabouts. Emergency response teams rely on quadrant systems for precise location identification, whereas sectors assist in traffic management and crowd control within circular arenas.
Conclusion: Choosing Between Quadrant and Sector
Choosing between quadrant and sector depends on the specific data visualization needs and clarity for the audience. Quadrants are ideal for dividing a chart into four distinct areas to compare variables based on two axes, while sectors, typically used in pie charts, effectively represent parts of a whole. Prioritizing the nature of data and the clarity of insights helps determine the most effective method for communicating quantitative relationships.
Quadrant Infographic