Qualitative research delves into understanding human behavior, experiences, and social phenomena through detailed, non-numerical data such as interviews, observations, and open-ended surveys. This approach allows for deep insights into motivations, opinions, and cultural contexts that quantitative methods often overlook. Explore the rest of this article to discover how qualitative techniques can enhance your research outcomes.
Table of Comparison
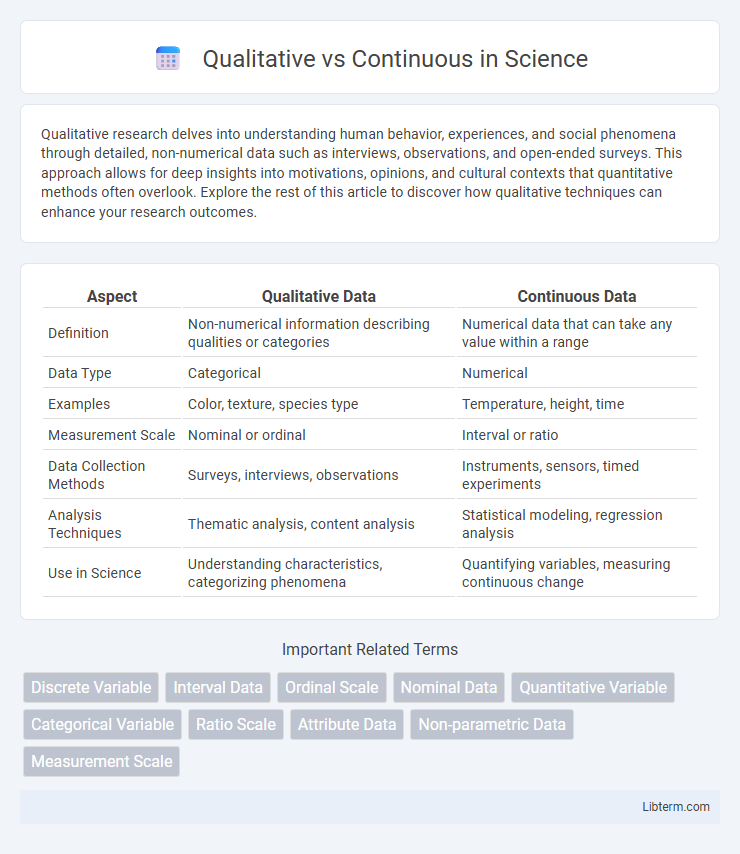
| Aspect | Qualitative Data | Continuous Data |
|---|---|---|
| Definition | Non-numerical information describing qualities or categories | Numerical data that can take any value within a range |
| Data Type | Categorical | Numerical |
| Examples | Color, texture, species type | Temperature, height, time |
| Measurement Scale | Nominal or ordinal | Interval or ratio |
| Data Collection Methods | Surveys, interviews, observations | Instruments, sensors, timed experiments |
| Analysis Techniques | Thematic analysis, content analysis | Statistical modeling, regression analysis |
| Use in Science | Understanding characteristics, categorizing phenomena | Quantifying variables, measuring continuous change |
Introduction to Qualitative and Continuous Data
Qualitative data consists of non-numeric categories or labels used to describe characteristics, such as colors, names, or types, and is essential for identifying patterns and themes in research. Continuous data refers to numerical values that can take any value within a range, like height, weight, or temperature, and allows for detailed statistical analysis and interpretation. Understanding the distinction between qualitative and continuous data is crucial for selecting appropriate data collection methods and analytical approaches in scientific and social research.
Defining Qualitative Data
Qualitative data refers to non-numeric information that describes qualities or characteristics, such as colors, textures, or categories like gender and nationality. Unlike continuous data, which involves numeric values measurable on a scale, qualitative data is often collected through observations, interviews, or textual analysis. This type of data is crucial for exploring patterns, themes, and subjective experiences that cannot be quantified.
Understanding Continuous Data
Continuous data represents numerical values that can take any value within a given range, such as height, temperature, or time, enabling detailed analysis through measurement scales. Understanding continuous data involves recognizing its infinite granularity, allowing for precise calculations of mean, median, variance, and other statistical metrics essential in fields like engineering and economics. This type of data differs from qualitative data, which is categorical and non-numeric, highlighting the importance of continuous data in quantitative research and predictive modeling.
Key Differences Between Qualitative and Continuous Data
Qualitative data categorizes information based on attributes or characteristics, such as colors, names, or labels, without numerical value, while continuous data represents measurable quantities that can take any value within a range, such as height, weight, or temperature. Qualitative data is often analyzed using thematic analysis or frequency counts, whereas continuous data is evaluated using statistical methods like mean, standard deviation, and regression analysis. The key difference lies in qualitative data being descriptive and categorical, whereas continuous data is numerical and quantifiable for precise measurement.
Real-World Examples of Qualitative Data
Qualitative data includes real-world examples such as customer feedback, interview transcripts, and social media comments, which provide insights into opinions, feelings, and experiences. This type of data is non-numerical and is often categorized into themes or patterns to understand human behavior and preferences. Unlike continuous data, which involves measurable quantities like temperature or time, qualitative data captures the richness of context and subjective perspectives.
Real-World Examples of Continuous Data
Continuous data represents measurements that can take any value within a range, such as height, temperature, or time. Real-world examples include monitoring blood pressure levels in healthcare, recording daily temperatures in meteorology, and measuring speed during a vehicle's trip. Unlike qualitative data, continuous data enables precise numerical analysis and supports detailed statistical modeling.
Data Collection Methods for Qualitative vs Continuous
Qualitative data collection methods include interviews, focus groups, and open-ended surveys that gather non-numerical insights to explore behaviors, motivations, and experiences in depth. Continuous data collection relies on instruments like sensors, automated tracking systems, and time-series measurements to record quantitative data points over time without interruption. Choosing between these approaches depends on the research goal: understanding context and meaning versus monitoring trends and fluctuations quantitatively.
Best Practices for Analyzing Each Data Type
Qualitative data analysis benefits from thematic coding and narrative techniques to uncover patterns, insights, and contextual meanings within non-numeric information such as interviews or open-ended survey responses. Continuous data analysis requires statistical methods like regression, ANOVA, and descriptive statistics to accurately measure trends, correlations, and variations in numeric datasets from sources such as sensor readings or financial records. Employing appropriate software tools--NVivo or Atlas.ti for qualitative and SPSS or R for continuous data--enhances precision, reproducibility, and clarity in interpreting complex datasets.
Common Applications in Research and Industry
Qualitative data is extensively used in market research, social sciences, and user experience studies to explore behaviors, opinions, and motivations through interviews, focus groups, and content analysis. Continuous data plays a critical role in engineering, manufacturing, and biomedical fields where precise measurements like temperature, weight, and time are essential for process optimization and statistical analysis. Both data types complement each other in research and industry by providing comprehensive insights through numerical precision and rich contextual understanding.
Choosing the Right Data Type for Your Study
Selecting the appropriate data type is essential for accurate analysis and valid conclusions in research. Qualitative data offers rich, descriptive insights into behaviors and experiences, making it ideal for exploratory studies and understanding complex phenomena. Continuous data provides precise numerical measurements that enable statistical testing and trend identification, crucial for hypothesis-driven research and quantifying relationships.
Qualitative Infographic