Regression is a powerful statistical technique used to model and analyze the relationships between variables, helping predict outcomes based on input data. It is widely applied in various fields such as finance, healthcare, and marketing to identify trends and make informed decisions. Explore the rest of this article to understand how regression can enhance your data analysis skills and improve predictive accuracy.
Table of Comparison
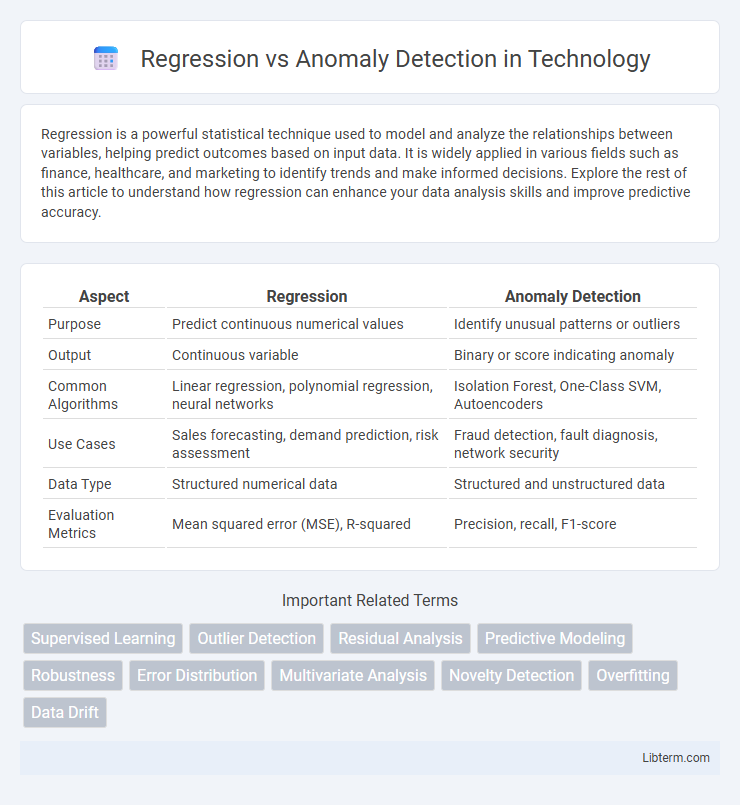
| Aspect | Regression | Anomaly Detection |
|---|---|---|
| Purpose | Predict continuous numerical values | Identify unusual patterns or outliers |
| Output | Continuous variable | Binary or score indicating anomaly |
| Common Algorithms | Linear regression, polynomial regression, neural networks | Isolation Forest, One-Class SVM, Autoencoders |
| Use Cases | Sales forecasting, demand prediction, risk assessment | Fraud detection, fault diagnosis, network security |
| Data Type | Structured numerical data | Structured and unstructured data |
| Evaluation Metrics | Mean squared error (MSE), R-squared | Precision, recall, F1-score |
Understanding Regression and Anomaly Detection
Regression analyzes relationships between variables to predict continuous outcomes based on input features, optimizing models for accurate trend estimation and forecasting. Anomaly detection identifies patterns that deviate significantly from expected behavior, often using statistical or machine learning techniques to flag rare or unusual events. Both approaches rely on data-driven insights but serve distinct purposes: regression for prediction and anomaly detection for identifying irregularities.
Key Differences Between Regression and Anomaly Detection
Regression predicts continuous numerical values based on input features, aiming to model the relationship between dependent and independent variables. Anomaly detection identifies rare, unusual patterns or outliers in data that deviate significantly from the norm, often without labeled examples. While regression focuses on forecasting or estimating values, anomaly detection emphasizes discovering instances that do not conform to expected behavior patterns.
Use Cases for Regression
Regression models excel in predicting continuous values such as sales forecasting, price estimation, and demand planning. These use cases require learning relationships between dependent and independent variables to generate precise numerical outputs. In contrast to anomaly detection, which identifies outliers or unusual patterns, regression is crucial for trend analysis and decision-making based on quantitative predictions.
Applications of Anomaly Detection
Anomaly detection is crucial in applications such as fraud detection in financial transactions, network security intrusion identification, and fault diagnosis in manufacturing systems. Unlike regression, which predicts continuous outcomes based on input variables, anomaly detection focuses on identifying rare or unusual patterns that deviate from normal behavior. This technique enables timely intervention and prevention in critical sectors like healthcare monitoring and predictive maintenance.
Types of Regression Techniques
Regression techniques include linear regression, which models the relationship between variables using a straight line, polynomial regression that fits data points with a polynomial equation, and ridge regression, which adds regularization to prevent overfitting. Other types include lasso regression, useful for feature selection by shrinking coefficients to zero, and logistic regression, applied for binary classification but often considered in regression contexts. These methods differ fundamentally from anomaly detection, which identifies outliers in data rather than predicting continuous values.
Common Anomaly Detection Methods
Common anomaly detection methods include statistical techniques, clustering-based approaches, and machine learning models like Isolation Forest and One-Class SVM. These methods identify deviations from normal patterns without relying on labeled data, contrasting with regression models that predict continuous outcomes based on input variables. Techniques such as Principal Component Analysis (PCA) and autoencoders also play a significant role in detecting anomalies by capturing data distribution and reconstructing inputs to highlight outliers.
Choosing the Right Approach: Factors to Consider
Choosing between regression and anomaly detection depends on the problem's objective and data characteristics. Regression is ideal for predicting continuous outcomes based on input variables, whereas anomaly detection focuses on identifying rare or unexpected patterns that deviate from normal behavior. Factors such as data distribution, the presence of labeled anomalies, computational resources, and the need for interpretability guide the selection of the most suitable approach.
Data Requirements for Regression vs Anomaly Detection
Regression models require labeled data with continuous output variables to learn accurate prediction functions, often demanding extensive datasets to capture diverse input-output relationships. Anomaly detection primarily relies on normal behavior data to identify deviations, frequently operating with limited or unlabeled data, making it suitable for unsupervised or semi-supervised learning scenarios. The difference in data requirements impacts model selection, with regression needing comprehensive ground-truth data, while anomaly detection emphasizes quality and representativeness of normal patterns.
Evaluation Metrics for Both Techniques
Regression evaluation metrics primarily include Mean Squared Error (MSE), Root Mean Squared Error (RMSE), and R-squared (R2) to measure prediction accuracy and model fit. Anomaly detection is assessed using metrics such as Precision, Recall, F1-Score, and Area Under the Receiver Operating Characteristic Curve (AUC-ROC) to evaluate the ability to correctly identify outliers. Both techniques require careful selection of evaluation metrics to balance false positives and false negatives depending on the specific application context.
Real-World Examples and Case Studies
Regression models excel in predicting continuous outcomes such as housing prices or sales forecasts, demonstrated by case studies in real estate and retail industries. Anomaly detection is critical for identifying unusual patterns like fraudulent transactions in banking or network intrusions in cybersecurity, supported by real-world examples from financial institutions and IT security firms. Both techniques serve distinct purposes: regression forecasts trends while anomaly detection highlights deviations, optimizing decision-making across various sectors.
Regression Infographic