Metrics collection involves gathering data to measure performance, efficiency, and progress across various processes or systems. Accurate metrics provide valuable insights that help identify trends, pinpoint issues, and guide informed decision-making. Explore the rest of the article to learn effective strategies for optimizing your metrics collection.
Table of Comparison
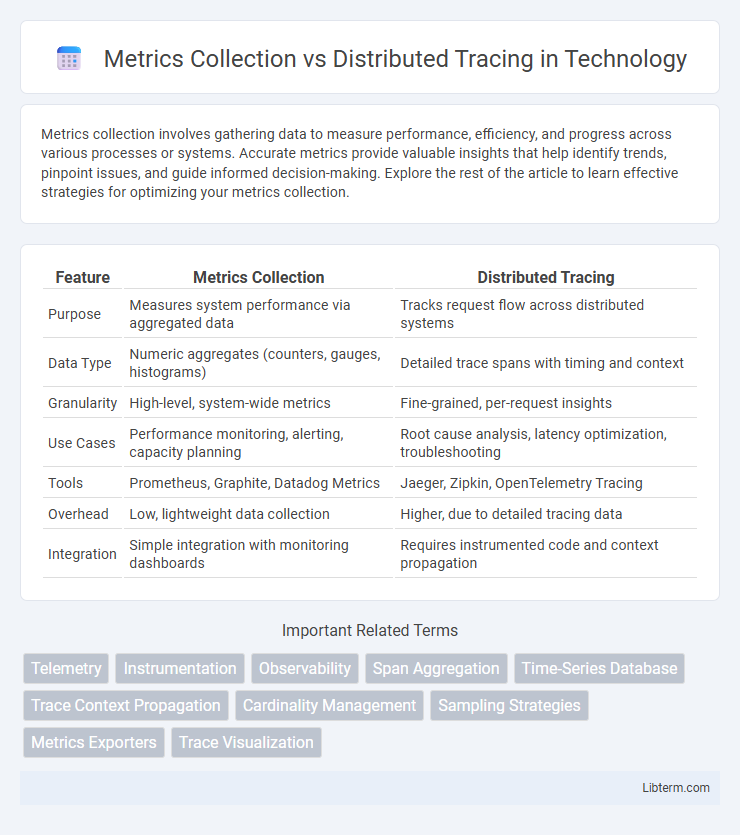
| Feature | Metrics Collection | Distributed Tracing |
|---|---|---|
| Purpose | Measures system performance via aggregated data | Tracks request flow across distributed systems |
| Data Type | Numeric aggregates (counters, gauges, histograms) | Detailed trace spans with timing and context |
| Granularity | High-level, system-wide metrics | Fine-grained, per-request insights |
| Use Cases | Performance monitoring, alerting, capacity planning | Root cause analysis, latency optimization, troubleshooting |
| Tools | Prometheus, Graphite, Datadog Metrics | Jaeger, Zipkin, OpenTelemetry Tracing |
| Overhead | Low, lightweight data collection | Higher, due to detailed tracing data |
| Integration | Simple integration with monitoring dashboards | Requires instrumented code and context propagation |
Introduction to Metrics Collection and Distributed Tracing
Metrics collection involves gathering quantitative data such as CPU usage, memory consumption, and request counts to monitor system performance and health. Distributed tracing captures detailed end-to-end information about individual requests as they propagate through various services, enabling in-depth root cause analysis. Both techniques complement each other by providing metrics for overall system insights and traces for granular transaction visibility.
Defining Metrics Collection in Modern Applications
Metrics collection in modern applications involves systematically gathering quantitative data such as CPU usage, memory consumption, request latency, and error rates to monitor system performance and reliability. This process enables real-time observability by aggregating time-series data points, facilitating anomaly detection, trend analysis, and capacity planning. Effective metrics collection integrates with monitoring tools like Prometheus and Grafana, providing operators with actionable insights to maintain application health.
What is Distributed Tracing?
Distributed tracing is a method used to monitor and track the flow of requests across various services in complex, microservices-based systems, enabling detailed visualization of end-to-end transaction paths. It captures timing and metadata for each segment of a request, revealing performance bottlenecks and latency issues that metrics collection alone cannot pinpoint. Unlike metrics collection, which aggregates system-wide data, distributed tracing provides granular, per-request insights crucial for diagnosing intricate interactions in distributed architectures.
Key Differences: Metrics Collection vs Distributed Tracing
Metrics collection captures aggregated numerical data such as latency, error rates, and throughput, providing a high-level overview of system health and performance. Distributed tracing records detailed transaction paths across microservices, revealing the sequence and timing of calls within complex, distributed architectures for pinpointing bottlenecks and failures. Metrics aid in identifying trends and anomalies, while distributed tracing offers granular insights necessary for root cause analysis in interconnected systems.
Use Cases for Metrics Collection
Metrics collection excels in monitoring system performance by aggregating numerical data such as CPU usage, memory consumption, and request rates, enabling real-time alerting and capacity planning. It supports trend analysis and SLA compliance by providing quantifiable insights into system health over time. Use cases include resource optimization, anomaly detection, and generating dashboards for continuous operational visibility.
When to Use Distributed Tracing
Distributed tracing is essential when diagnosing complex, multi-service applications where pinpointing latency, failures, or performance bottlenecks across different microservices is critical. It captures detailed, end-to-end transaction flows, enabling developers to identify the exact service or component causing issues in a distributed system. Use distributed tracing in environments with high service interdependencies, asynchronous communications, or when deep visibility into user request paths is required for root cause analysis.
Advantages of Combining Both Approaches
Combining metrics collection and distributed tracing enhances observability by providing both high-level system performance data and detailed transaction insights. Metrics enable quick detection of anomalies through aggregated numerical indicators, while distributed tracing offers precise tracing of request flows across microservices, aiding root cause analysis. This synergy accelerates troubleshooting, improves system reliability, and optimizes resource allocation for complex cloud-native architectures.
Common Metrics Collection Tools and Solutions
Prominent metrics collection tools like Prometheus, Grafana, and Datadog provide robust monitoring solutions, capturing time-series data and system performance indicators. Distributed tracing tools such as Jaeger and Zipkin complement metrics by visualizing request flows and latencies across microservices architectures. Integrating metrics collection with distributed tracing enables comprehensive observability, enhancing root cause analysis and performance optimization.
Leading Distributed Tracing Tools and Frameworks
Leading distributed tracing tools like Jaeger, Zipkin, and OpenTelemetry offer comprehensive visibility into microservices architectures by capturing detailed trace data across system components. These frameworks enable developers to correlate request flows, identify latency bottlenecks, and troubleshoot errors more effectively compared to traditional metrics collection, which aggregates performance data without contextual tracing. OpenTelemetry, in particular, provides a vendor-neutral standard for trace, metric, and log collection, facilitating seamless integration and observability in complex distributed environments.
Best Practices for Observability in Microservices
Metrics collection provides quantitative data on system performance such as request rates, error rates, and latency percentiles, enabling quick detection of anomalies in microservices. Distributed tracing captures detailed end-to-end transaction flows across multiple microservices, offering deep insights into latency bottlenecks and inter-service dependencies for root cause analysis. Combining both techniques with standardized instrumentation frameworks like OpenTelemetry enhances observability by delivering comprehensive, correlated telemetry data essential for proactive monitoring and troubleshooting in complex microservice architectures.
Metrics Collection Infographic