Resource starvation occurs when critical system resources such as CPU, memory, or I/O are heavily contested, causing processes to experience significant delays or complete halt. This condition can lead to severe performance degradation and system instability, impacting the reliability of applications. Explore this article to understand the causes, symptoms, and solutions to effectively manage resource starvation and optimize your system performance.
Table of Comparison
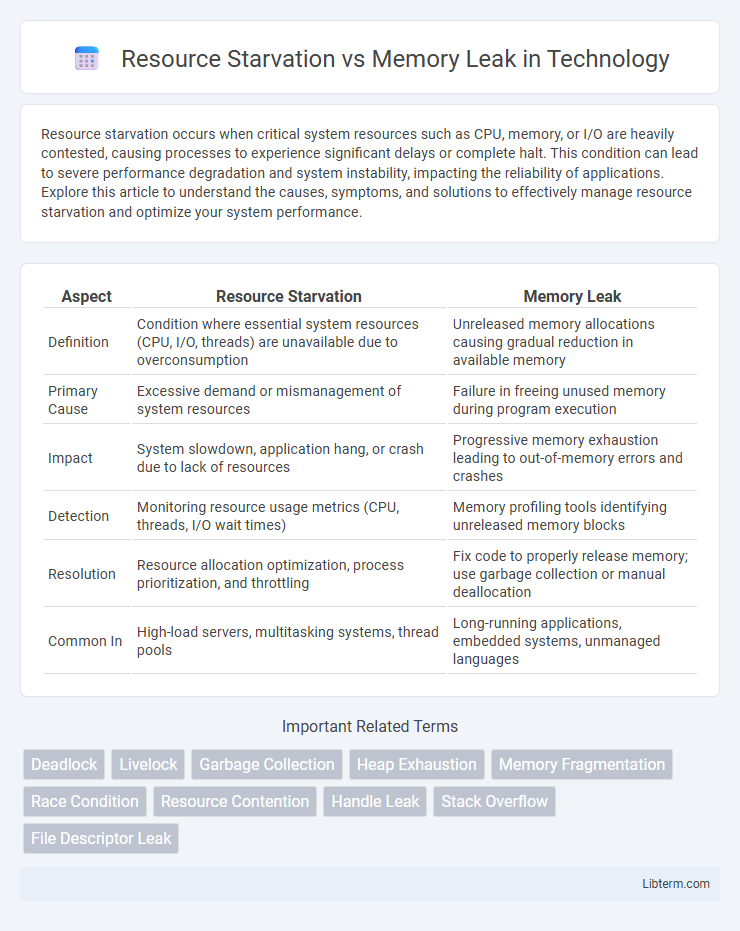
| Aspect | Resource Starvation | Memory Leak |
|---|---|---|
| Definition | Condition where essential system resources (CPU, I/O, threads) are unavailable due to overconsumption | Unreleased memory allocations causing gradual reduction in available memory |
| Primary Cause | Excessive demand or mismanagement of system resources | Failure in freeing unused memory during program execution |
| Impact | System slowdown, application hang, or crash due to lack of resources | Progressive memory exhaustion leading to out-of-memory errors and crashes |
| Detection | Monitoring resource usage metrics (CPU, threads, I/O wait times) | Memory profiling tools identifying unreleased memory blocks |
| Resolution | Resource allocation optimization, process prioritization, and throttling | Fix code to properly release memory; use garbage collection or manual deallocation |
| Common In | High-load servers, multitasking systems, thread pools | Long-running applications, embedded systems, unmanaged languages |
Understanding Resource Starvation
Resource starvation occurs when a process or application is denied access to necessary system resources such as CPU time, memory, or I/O access, leading to degraded performance or failure. Unlike memory leaks, which specifically involve the improper management and continuous consumption of memory, resource starvation can result from resource contention, priority inversions, or deadlocks affecting various resource types. Identifying resource starvation involves monitoring system metrics like CPU usage, memory allocation, and I/O wait times to detect bottlenecks and ensure fair resource distribution across processes.
What is a Memory Leak?
A memory leak occurs when a program incorrectly manages memory allocations, causing it to retain unused memory blocks that are no longer needed. This leads to steadily increasing memory consumption and can degrade system performance or cause crashes. Memory leaks differ from resource starvation, which refers to the exhaustion of system resources like CPU or disk I/O rather than persistent loss of available memory.
Key Differences Between Resource Starvation and Memory Leak
Resource starvation occurs when system components are unable to access necessary resources due to contention or prioritization issues, leading to performance degradation, while memory leak specifically refers to the unintended retention of allocated memory, causing gradual reduction of available memory over time. Key differences include that resource starvation affects diverse system resources like CPU, I/O, or network bandwidth, whereas memory leaks exclusively impact memory allocation and release processes. Resource starvation typically results in temporary unavailability or delays, but memory leaks cause sustained memory consumption leading to potential system crashes or slowdown.
Common Causes of Resource Starvation
Resource starvation commonly arises from insufficient allocation of system resources such as CPU cycles, memory, or file handles, often due to processes consuming excessive resources or mismanagement in resource scheduling. A frequent cause includes unbounded thread creation or infinite loops that monopolize CPU time. Inefficient locking mechanisms leading to deadlocks or priority inversion can also severely limit resource availability, exacerbating resource starvation issues.
Typical Triggers for Memory Leaks
Typical triggers for memory leaks include unreleased dynamically allocated memory, improper handling of object references in languages like Java or C#, and neglected event listeners or callbacks that prevent garbage collection. Resource starvation often arises from these leaks as the application exhausts available memory, causing degraded performance or crashes. Debugging tools such as profilers and memory analyzers help identify and resolve lingering allocations that contribute to memory bloat.
Impact of Resource Starvation on System Performance
Resource starvation significantly degrades system performance by limiting critical resources such as CPU, memory, or I/O bandwidth, causing processes to be delayed or halted. This leads to increased latency, reduced throughput, and potential deadlocks, severely impacting application responsiveness and overall system stability. Unlike memory leaks, which gradually consume memory, resource starvation can cause abrupt performance bottlenecks affecting multiple system components simultaneously.
Effects of Memory Leaks on Applications
Memory leaks cause applications to consume increasing amounts of RAM over time, leading to slow performance, system instability, and eventual crashes. They reduce available memory resources, which can trigger resource starvation as other processes compete for limited system memory. Persistent memory leaks degrade user experience by causing application freezes, increased latency, and potential data corruption.
Detection Techniques for Resource Starvation
Resource starvation occurs when a system is unable to allocate resources due to excessive demand, often leading to degraded performance or deadlock, whereas a memory leak specifically refers to unreleased memory that accumulates over time. Detection techniques for resource starvation include employing performance monitoring tools to track resource utilization metrics such as CPU, memory, and I/O throughput, using deadlock detection algorithms to identify circular waits, and implementing monitoring frameworks like Prometheus combined with alerting systems to observe resource allocation patterns and identify bottlenecks proactively. These methods help isolate resource contention issues before they escalate into system failures.
Methods to Identify and Fix Memory Leaks
Memory leaks can be identified using profiling tools like Valgrind, VisualVM, or built-in language-specific debuggers that detect unreleased memory or increasing heap usage over time. Fixing memory leaks involves ensuring proper deallocation of allocated memory, using smart pointers or garbage collection mechanisms, and avoiding circular references in data structures. Monitoring application performance metrics and conducting regular code reviews help prevent resource starvation caused by persistent memory leaks.
Best Practices to Prevent Resource Starvation and Memory Leaks
Implementing automated monitoring tools to track memory usage and resource allocation helps identify early signs of resource starvation and memory leaks. Adopting efficient coding practices, such as proper object disposal and limiting concurrent resource requests, ensures optimal resource management. Regular code reviews and memory profiling combined with utilizing garbage collection tuning significantly reduce the risk of resource exhaustion and performance degradation.
Resource Starvation Infographic