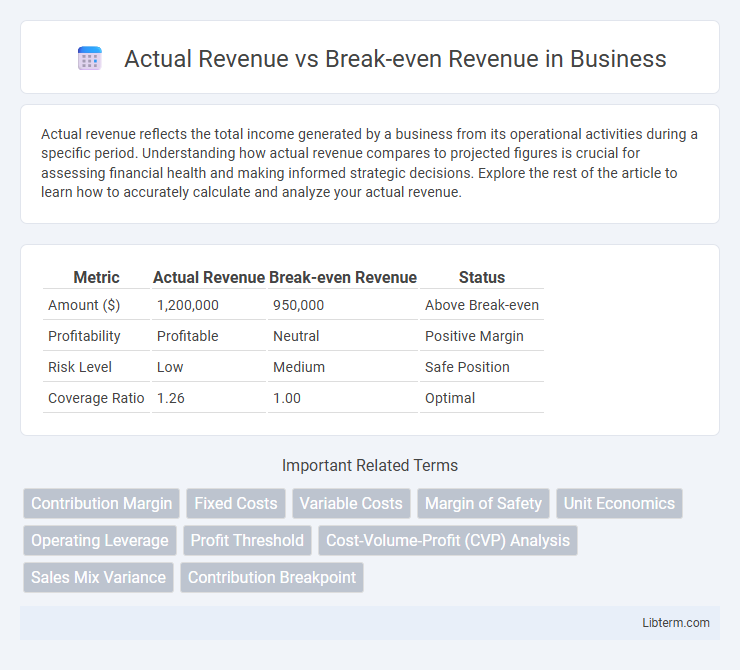
Actual revenue reflects the total income generated by a business from its operational activities during a specific period. Understanding how actual revenue compares to projected figures is crucial for assessing financial health and making informed strategic decisions. Explore the rest of the article to learn how to accurately calculate and analyze your actual revenue.
Table of Comparison
| Metric | Actual Revenue | Break-even Revenue | Status |
|---|---|---|---|
| Amount ($) | 1,200,000 | 950,000 | Above Break-even |
| Profitability | Profitable | Neutral | Positive Margin |
| Risk Level | Low | Medium | Safe Position |
| Coverage Ratio | 1.26 | 1.00 | Optimal |
Understanding Actual Revenue and Break-even Revenue
Actual Revenue represents the total income generated from sales during a specific period, reflecting the company's real financial performance. Break-even Revenue is the minimum amount of sales required to cover all fixed and variable costs, indicating the point where the business neither makes a profit nor a loss. Understanding the relationship between Actual Revenue and Break-even Revenue helps businesses assess profitability and make informed financial decisions.
Key Differences Between Actual and Break-even Revenue
Actual revenue represents the total income generated from sales during a specific period, reflecting real business performance. Break-even revenue is the amount of income required to cover all fixed and variable costs, signifying the point at which a business neither profits nor incurs a loss. The key difference lies in actual revenue showing true earnings, while break-even revenue marks financial sustainability thresholds critical for strategic planning and profitability analysis.
Importance of Tracking Actual Revenue
Tracking actual revenue is crucial for measuring a company's financial performance against its break-even revenue, helping identify profitability thresholds. Accurate monitoring allows businesses to adjust strategies, optimize costs, and improve cash flow management in real time. Understanding this comparison prevents losses and supports data-driven decision-making crucial for sustainable growth.
Calculating Break-even Revenue: Step-by-Step
Calculating break-even revenue involves determining the fixed costs and the contribution margin ratio, which is the percentage of each sales dollar available to cover fixed expenses after variable costs are deducted. The formula for break-even revenue is Fixed Costs divided by Contribution Margin Ratio. By accurately identifying fixed costs and contribution margin, businesses can pinpoint the sales needed to avoid losses, thereby effectively managing financial planning and performance evaluation.
Factors Affecting Break-even Revenue
Break-even revenue is influenced by fixed costs, variable costs, and pricing strategies, which determine the minimum income required to cover total expenses. Changes in production volume, cost structure, and market demand directly impact the break-even point by altering expense distribution and revenue generation. Accurate analysis of cost behavior and sales mix is essential for businesses to set realistic revenue targets and ensure profitability beyond the break-even threshold.
Analyzing Revenue Variances for Business Growth
Actual Revenue exceeding Break-even Revenue indicates profitable operations, revealing effective cost management and sales strategies. Analyzing revenue variances helps identify deviations due to market demand, pricing, or operational efficiency, enabling targeted adjustments. Tracking these variances provides actionable insights for scaling growth and optimizing resource allocation.
Impact of Fixed and Variable Costs on Break-even Point
Fixed costs remain constant regardless of sales volume, significantly influencing the break-even revenue by setting a baseline that total revenue must exceed to avoid losses. Variable costs fluctuate directly with production levels, affecting the slope of total costs and altering how much revenue is required to reach the break-even point. Understanding the interplay between fixed and variable costs helps businesses accurately calculate break-even revenue and manage profitability effectively.
Strategies to Increase Actual Revenue Beyond Break-even
Implementing targeted marketing campaigns and optimizing pricing strategies effectively boost actual revenue beyond the break-even point by attracting higher-paying customers and increasing sales volume. Enhancing product value through innovation and upselling complementary services encourages repeat purchases and elevates average transaction size. Streamlining operational efficiency reduces costs, allowing reinvestment into growth initiatives that drive revenue further above the break-even threshold.
Common Mistakes in Revenue Analysis
Confusing actual revenue with break-even revenue often leads to inaccurate financial assessments and misguided decision-making. Analysts frequently overlook fixed and variable cost allocations, resulting in incorrect break-even calculations that do not reflect true profitability thresholds. Misinterpreting revenue fluctuations as profit changes without considering cost behavior distorts performance evaluations and strategic planning.
Actionable Insights for Revenue Optimization
Analyzing Actual Revenue versus Break-even Revenue reveals critical gaps in profit performance, enabling targeted strategies to enhance cash flow and reduce operational inefficiencies. Businesses can leverage this comparison to adjust pricing models, optimize cost structures, and improve sales tactics that drive revenue beyond the threshold where costs are fully covered. Monitoring these metrics continuously supports data-driven decisions, ensuring sustainable growth and maximizing profit margins.
Actual Revenue Infographic

 libterm.com