Fundamental analysis examines a company's financial health, including earnings, revenue, and growth potential, to determine its intrinsic value. This method helps investors make informed decisions by evaluating economic indicators and industry conditions affecting stock prices. Explore the article to understand how fundamental analysis can enhance your investment strategy.
Table of Comparison
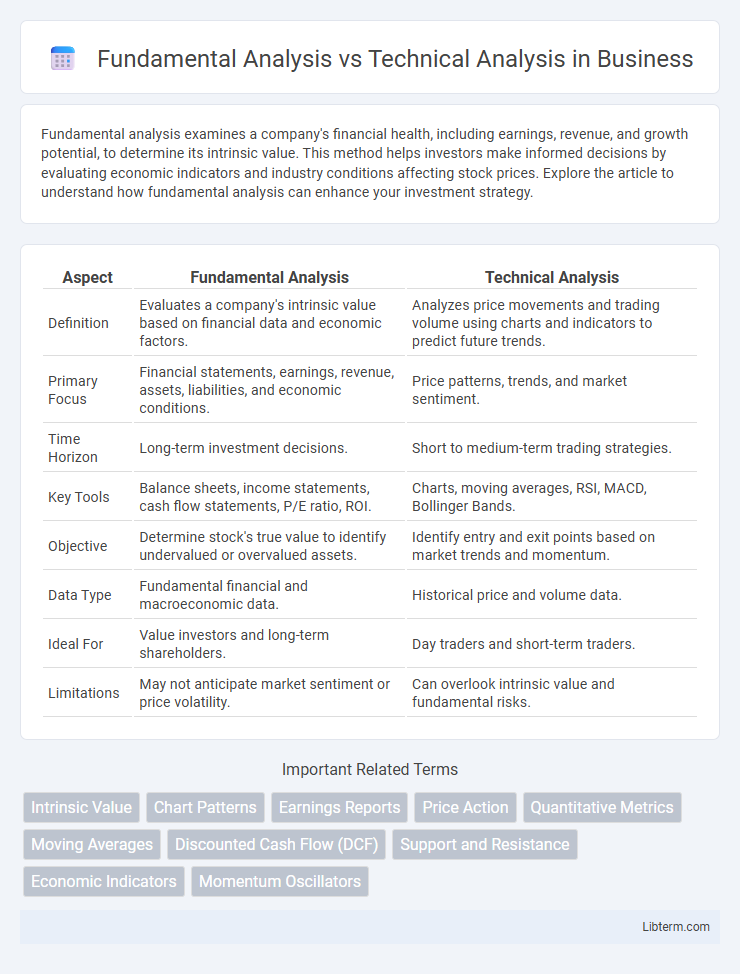
| Aspect | Fundamental Analysis | Technical Analysis |
|---|---|---|
| Definition | Evaluates a company's intrinsic value based on financial data and economic factors. | Analyzes price movements and trading volume using charts and indicators to predict future trends. |
| Primary Focus | Financial statements, earnings, revenue, assets, liabilities, and economic conditions. | Price patterns, trends, and market sentiment. |
| Time Horizon | Long-term investment decisions. | Short to medium-term trading strategies. |
| Key Tools | Balance sheets, income statements, cash flow statements, P/E ratio, ROI. | Charts, moving averages, RSI, MACD, Bollinger Bands. |
| Objective | Determine stock's true value to identify undervalued or overvalued assets. | Identify entry and exit points based on market trends and momentum. |
| Data Type | Fundamental financial and macroeconomic data. | Historical price and volume data. |
| Ideal For | Value investors and long-term shareholders. | Day traders and short-term traders. |
| Limitations | May not anticipate market sentiment or price volatility. | Can overlook intrinsic value and fundamental risks. |
Introduction to Investment Analysis
Fundamental analysis evaluates a company's intrinsic value by examining financial statements, industry conditions, and economic factors to determine long-term investment potential. Technical analysis studies historical price charts, trading volume, and market trends to predict short-term price movements and identify buy or sell signals. Investment analysis often combines both approaches to make informed decisions based on quantitative data and market psychology.
What is Fundamental Analysis?
Fundamental analysis evaluates a company's intrinsic value by examining financial statements, industry trends, economic indicators, and management performance. It involves analyzing key metrics such as earnings per share (EPS), price-to-earnings (P/E) ratio, revenue growth, and debt levels to determine a stock's long-term potential. This method helps investors make decisions based on the underlying health and prospects of a business rather than market price movements.
Key Components of Fundamental Analysis
Fundamental analysis focuses on evaluating a company's intrinsic value by examining financial statements, such as income statements, balance sheets, and cash flow statements, along with key metrics like earnings per share (EPS), price-to-earnings (P/E) ratio, and return on equity (ROE). It also involves assessing economic indicators, industry conditions, and management quality to forecast long-term growth potential. These components help investors determine whether a stock is undervalued or overvalued compared to its market price.
What is Technical Analysis?
Technical analysis involves evaluating securities by analyzing statistical trends from trading activity, such as price movement and volume, rather than focusing on a company's fundamentals. Chart patterns, moving averages, and momentum indicators are commonly used tools to predict future price behavior in financial markets. This method relies heavily on historical price data and market psychology to identify entry and exit points for trades.
Core Principles of Technical Analysis
Technical analysis centers on studying historical price movements and trading volumes to predict future market trends, relying heavily on chart patterns, trend lines, and technical indicators like moving averages and Relative Strength Index (RSI). It assumes that all relevant information is already reflected in the price, emphasizing market psychology and sentiment over intrinsic value. Core principles include the concepts of price discounting all information, prices moving in trends, and history tending to repeat itself, enabling traders to identify entry and exit points based on statistical probabilities.
Major Differences Between Fundamental and Technical Analysis
Fundamental analysis evaluates a security's intrinsic value by examining economic indicators, financial statements, and industry conditions, focusing on long-term investment potential. Technical analysis studies price movements, trading volumes, and chart patterns to forecast short-term market trends and investor behavior. Major differences lie in their approaches: fundamental analysis relies on qualitative and quantitative data about a company's performance, while technical analysis depends solely on historical price data and market sentiment.
Advantages of Fundamental Analysis
Fundamental analysis provides a comprehensive evaluation of a company's intrinsic value by examining financial statements, revenue growth, profit margins, and market conditions. This approach helps investors identify undervalued stocks with strong long-term growth potential and make informed decisions based on economic indicators and industry trends. By focusing on a company's fundamentals, investors gain insights into sustainability and risk factors often missed by short-term price movements in technical analysis.
Benefits of Technical Analysis
Technical analysis offers real-time insights through price charts and trading volumes, allowing traders to identify short-term market trends and entry or exit points with precision. It benefits from quantitative data patterns, such as moving averages, RSI, and MACD, which enable objective decision-making without reliance on company fundamentals. This approach is especially advantageous in volatile markets, providing flexibility and rapid response to price movements.
When to Use Each Analysis Method
Fundamental analysis is ideal for long-term investors aiming to evaluate a company's intrinsic value by examining financial statements, industry conditions, and economic indicators. Technical analysis suits short-term traders who rely on price patterns, volume trends, and momentum indicators to time market entries and exits. Choosing between these methods depends on investment goals, with fundamental analysis guiding stock selection and technical analysis optimizing trade timing.
Conclusion: Choosing the Right Approach
Fundamental analysis emphasizes evaluating a company's intrinsic value through financial statements, management quality, and market conditions, making it ideal for long-term investors seeking sustainable growth. Technical analysis relies on historical price patterns, volume, and chart indicators to forecast short-term market movements, benefiting traders focused on timing and momentum. Selecting the right approach depends on investment goals, risk tolerance, and time horizon, with many successful investors combining both methods for comprehensive decision-making.
Fundamental Analysis Infographic