The Capital Asset Pricing Model (CAPM) explains the relationship between expected return and risk of investing in a security, helping investors make informed decisions by evaluating beta, market risk premium, and risk-free rate. Understanding CAPM enables you to assess whether an asset offers a reasonable expected return relative to its systematic risk. Dive into the article for a deeper exploration of how CAPM shapes investment strategies and portfolio management.
Table of Comparison
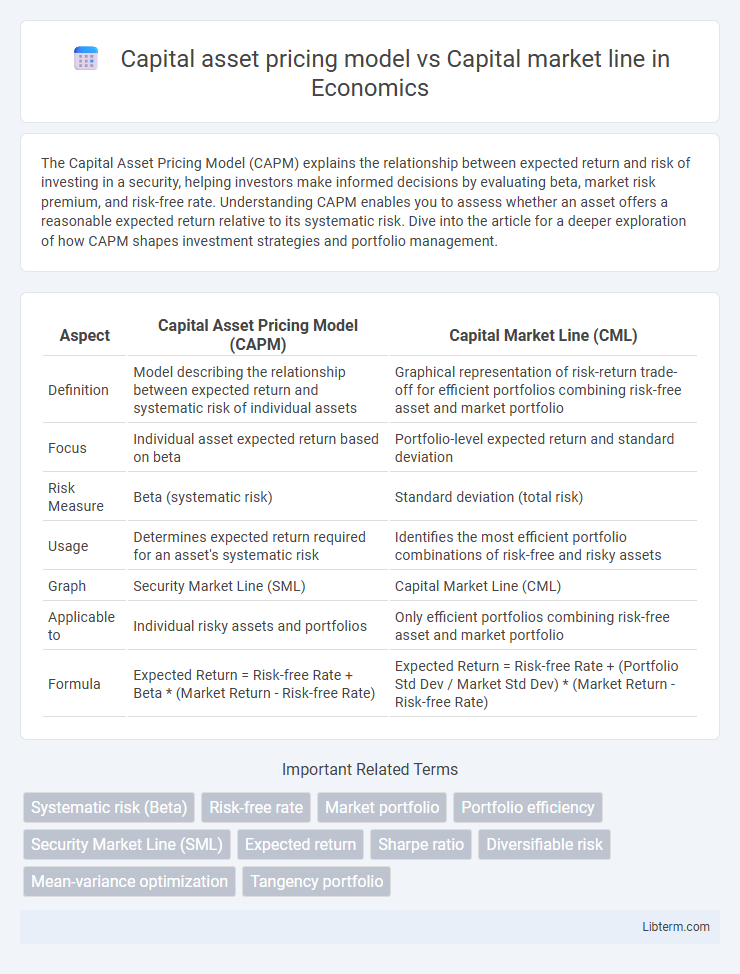
| Aspect | Capital Asset Pricing Model (CAPM) | Capital Market Line (CML) |
|---|---|---|
| Definition | Model describing the relationship between expected return and systematic risk of individual assets | Graphical representation of risk-return trade-off for efficient portfolios combining risk-free asset and market portfolio |
| Focus | Individual asset expected return based on beta | Portfolio-level expected return and standard deviation |
| Risk Measure | Beta (systematic risk) | Standard deviation (total risk) |
| Usage | Determines expected return required for an asset's systematic risk | Identifies the most efficient portfolio combinations of risk-free and risky assets |
| Graph | Security Market Line (SML) | Capital Market Line (CML) |
| Applicable to | Individual risky assets and portfolios | Only efficient portfolios combining risk-free asset and market portfolio |
| Formula | Expected Return = Risk-free Rate + Beta * (Market Return - Risk-free Rate) | Expected Return = Risk-free Rate + (Portfolio Std Dev / Market Std Dev) * (Market Return - Risk-free Rate) |
Introduction to Capital Asset Pricing Model (CAPM)
The Capital Asset Pricing Model (CAPM) establishes a linear relationship between expected return and systematic risk, represented by beta, helping investors price risky securities efficiently. The Capital Market Line (CML) depicts the risk-return trade-off for efficient portfolios, combining the risk-free asset with the market portfolio, showing the highest expected return for a given level of risk. Unlike the CML, which applies to efficient portfolios, CAPM can evaluate individual assets' expected returns based on their contribution to overall market risk.
Understanding the Capital Market Line (CML)
The Capital Market Line (CML) represents the risk-return trade-off for efficient portfolios combining the risk-free asset and the market portfolio, highlighting optimal asset allocation. Unlike the Capital Asset Pricing Model (CAPM), which assesses expected returns for individual assets based on beta, the CML illustrates the expected return of portfolios along the efficient frontier with varying levels of systematic risk measured by standard deviation. Understanding the CML enables investors to determine the best portfolio mix that maximizes returns for a given level of total risk.
Core Assumptions of CAPM and CML
The Capital Asset Pricing Model (CAPM) assumes investors are rational and markets are frictionless with homogeneous expectations, relying on systematic risk measured by beta to determine expected returns. The Capital Market Line (CML) represents the risk-return trade-off for efficient portfolios, assuming investors can borrow and lend at a risk-free rate and all investors hold combinations of the market portfolio and the risk-free asset. Both CAPM and CML assume perfect competition, no taxes or transaction costs, and investors optimize portfolios based on mean-variance efficiency.
Key Formulae: CAPM vs CML
The Capital Asset Pricing Model (CAPM) key formula, E(Ri) = Rf + bi [E(Rm) - Rf], calculates the expected return of an asset based on its beta, the risk-free rate, and the market risk premium. The Capital Market Line (CML) formula, E(Rp) = Rf + [(E(Rm) - Rf) / sm] sp, expresses the expected return of an efficient portfolio given the portfolio's standard deviation, the risk-free rate, and the market portfolio's return and risk. CAPM focuses on individual asset returns using systematic risk (beta), whereas CML applies to efficient portfolios, emphasizing total risk (standard deviation).
Risk-Return Relationship in CAPM vs CML
The Capital Asset Pricing Model (CAPM) characterizes the risk-return relationship through systematic risk measured by beta, linking expected portfolio returns to market risk. The Capital Market Line (CML) represents the risk-return trade-off for efficient portfolios by illustrating the relationship between expected return and total risk (standard deviation) in a fully diversified portfolio. While CAPM focuses on individual asset risk relative to market risk, CML emphasizes the optimal combination of risk-free and market portfolio for achieving the highest expected return per unit of total risk.
The Role of Market Portfolio in Both Models
The Capital Asset Pricing Model (CAPM) uses the market portfolio as the benchmark representing all risky assets, establishing the relationship between expected return and systematic risk (beta). The Capital Market Line (CML) depicts the risk-return trade-off for efficient portfolios, with the market portfolio as the tangency point between the efficient frontier and the risk-free rate, indicating optimal portfolio allocation. Both models hinge on the market portfolio's role in defining efficient investment choices and guiding asset pricing based on market equilibrium.
Practical Applications in Portfolio Management
The Capital Asset Pricing Model (CAPM) quantifies the expected return on an asset based on its systematic risk, guiding portfolio managers in asset selection and risk assessment. The Capital Market Line (CML) represents the risk-return trade-off for efficient portfolios combining a risk-free asset with the market portfolio, helping in optimal capital allocation and diversification strategies. Utilizing CAPM and the CML enables portfolio managers to balance risk and return, optimize asset weights, and achieve targeted investment objectives in real-world portfolio construction.
Limitations and Criticisms
The Capital Asset Pricing Model (CAPM) assumes a linear relationship between expected return and beta, but it often fails to capture real-world market anomalies such as size and value effects, leading to inaccurate risk assessments. The Capital Market Line (CML) presumes investors can borrow and lend at a risk-free rate, which is unrealistic, and it applies only to efficient portfolios, limiting its practical use for individual asset evaluation. Both models rely on assumptions like market efficiency and single-period horizons, attracting criticism for oversimplifying market dynamics and ignoring factors like liquidity, taxes, and behavioral biases.
CAPM vs CML: Real-World Implications
The Capital Asset Pricing Model (CAPM) estimates expected returns based on systematic risk using beta, reflecting individual asset sensitivity to market movements, while the Capital Market Line (CML) represents efficient portfolios combining risk-free assets and the market portfolio, highlighting optimal risk-return trade-offs. CAPM is crucial for asset pricing and investment decision-making by quantifying risk-specific returns, whereas CML guides portfolio construction focusing on maximizing returns per unit of total risk (standard deviation). Real-world applications reveal CAPM's limitations in explaining returns for diversified portfolios, whereas CML remains a practical benchmark for assessing portfolio efficiency in modern portfolio theory.
Conclusion: Choosing the Right Approach
Selecting the appropriate approach depends on the investment context and risk assessment goals. The Capital Asset Pricing Model (CAPM) is ideal for estimating expected returns based on individual asset risk, while the Capital Market Line (CML) provides optimal portfolios combining risk-free assets with market portfolios for diversified investments. Investors prioritizing precise cost of equity calculations often prefer CAPM, whereas those focusing on portfolio optimization and efficient frontier analysis benefit from the insights of the CML.
Capital asset pricing model Infographic