The Laffer curve illustrates the relationship between tax rates and tax revenue, demonstrating that increasing tax rates beyond a certain point can actually reduce total revenue collected by the government. It emphasizes the balance needed to optimize taxation without discouraging productivity and economic growth. Explore the rest of the article to understand how this concept impacts fiscal policy and your financial decisions.
Table of Comparison
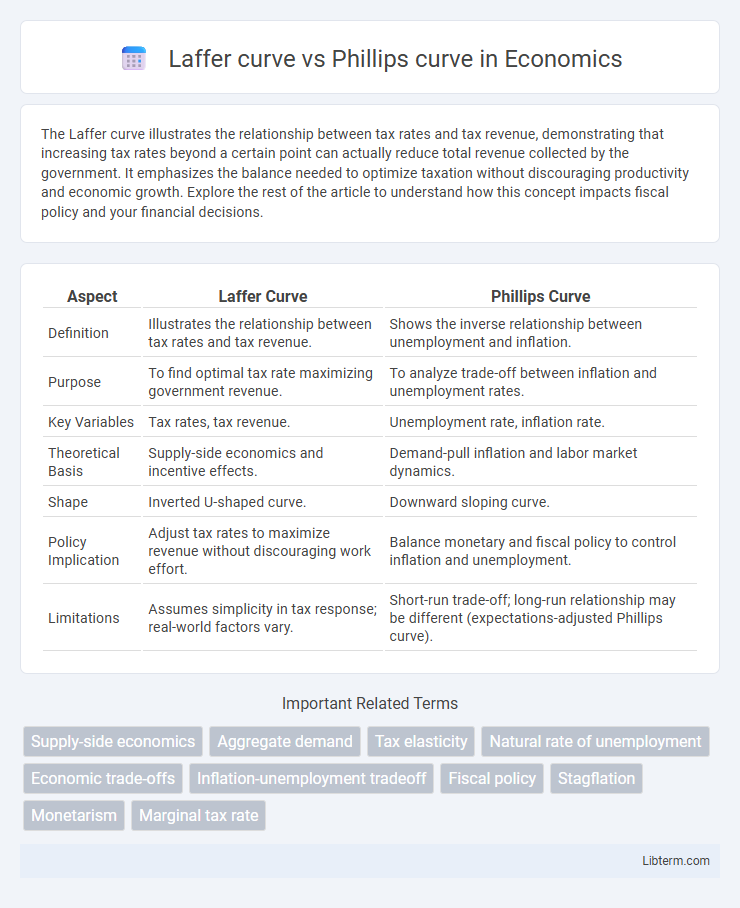
| Aspect | Laffer Curve | Phillips Curve |
|---|---|---|
| Definition | Illustrates the relationship between tax rates and tax revenue. | Shows the inverse relationship between unemployment and inflation. |
| Purpose | To find optimal tax rate maximizing government revenue. | To analyze trade-off between inflation and unemployment rates. |
| Key Variables | Tax rates, tax revenue. | Unemployment rate, inflation rate. |
| Theoretical Basis | Supply-side economics and incentive effects. | Demand-pull inflation and labor market dynamics. |
| Shape | Inverted U-shaped curve. | Downward sloping curve. |
| Policy Implication | Adjust tax rates to maximize revenue without discouraging work effort. | Balance monetary and fiscal policy to control inflation and unemployment. |
| Limitations | Assumes simplicity in tax response; real-world factors vary. | Short-run trade-off; long-run relationship may be different (expectations-adjusted Phillips curve). |
Introduction to the Laffer Curve and Phillips Curve
The Laffer Curve illustrates the relationship between tax rates and tax revenue, suggesting that there is an optimal tax rate that maximizes government revenue without discouraging productivity. The Phillips Curve represents the inverse relationship between inflation and unemployment, indicating that lower unemployment rates tend to coincide with higher inflation levels. Both economic models are fundamental in fiscal and monetary policy analysis for balancing growth, inflation, and employment.
Historical Background of Both Economic Theories
The Laffer Curve, developed in the 1970s by economist Arthur Laffer, illustrates the relationship between tax rates and tax revenue, emphasizing optimal taxation to maximize government income without discouraging productivity. The Phillips Curve, introduced by A.W. Phillips in 1958, demonstrates the inverse relationship between unemployment and inflation observed in post-war Britain, shaping monetary policy debates. Both theories emerged during periods of economic restructuring, influencing fiscal and monetary policies through their differing perspectives on managing economic growth and stability.
Key Concepts: Taxation vs. Inflation-Unemployment Tradeoff
The Laffer Curve illustrates the relationship between tax rates and tax revenue, highlighting the point where higher tax rates actually reduce revenue due to decreased economic activity. The Phillips Curve represents the inverse relationship between inflation and unemployment, suggesting that lower unemployment can lead to higher inflation and vice versa. While the Laffer Curve emphasizes taxation efficiency and optimal tax rates, the Phillips Curve focuses on the tradeoff policymakers face between controlling inflation and maintaining employment.
Theoretical Foundations of the Laffer Curve
The Laffer Curve is grounded in supply-side economics, illustrating the relationship between tax rates and tax revenue, positing that beyond a certain tax rate, increases lead to reduced revenue due to decreased incentives for work and investment. It relies on the theory of diminishing returns and behavioral responses to taxation, emphasizing the trade-off between tax rates and economic activity. Unlike the Phillips Curve, which explores the short-run trade-off between inflation and unemployment, the Laffer Curve focuses on fiscal policy effectiveness and optimizing tax structures for maximum revenue without hindering growth.
Theoretical Foundations of the Phillips Curve
The Phillips Curve is grounded in the theoretical premise that inflation and unemployment share an inverse relationship, where lower unemployment rates typically correspond with higher inflation due to increased wage pressures. It originates from the empirical observations of economist A.W. Phillips, who identified a stable negative correlation between wage inflation and unemployment in the short run. Unlike the Laffer Curve, which analyzes tax rates and government revenue, the Phillips Curve centers on labor market dynamics and inflation expectations within macroeconomic policy frameworks.
Empirical Evidence: Laffer Curve in Practice
Empirical evidence for the Laffer Curve demonstrates varying tax rates' impact on government revenue, with studies showing optimal tax rates differ by country and economic context. Historical data from the 1980s U.S. tax cuts under Reagan suggest potential revenue increases through lower marginal tax rates, yet recent analyses reveal diminishing returns if rates fall below a critical threshold. Cross-country comparisons highlight how labor supply elasticity, tax compliance, and economic structure influence the Laffer Curve's practical application, underscoring the complexity of pinpointing a universal revenue-maximizing tax rate.
Empirical Evidence: Phillips Curve in Practice
Empirical evidence on the Phillips curve reveals a historically observed inverse relationship between inflation and unemployment, though this correlation has weakened over time, particularly since the 1970s stagflation period. Recent macroeconomic data show that inflation expectations and supply shocks play a significant role in influencing this dynamic, complicating the predictability of the Phillips curve. Central banks increasingly consider this variability when setting monetary policy, acknowledging that the Phillips curve's stability and effectiveness as a guide for inflation targeting is context-dependent and sensitive to structural economic changes.
Policy Implications: Fiscal vs. Monetary Perspectives
The Laffer curve illustrates the fiscal policy trade-off between tax rates and government revenue, suggesting optimal tax rates to maximize revenue without discouraging work or investment. The Phillips curve highlights the monetary policy dilemma of balancing inflation and unemployment, demonstrating how central banks may manipulate interest rates to control inflation while impacting employment levels. Policymakers must weigh these perspectives: fiscal strategies target tax revenue and economic incentives, while monetary approaches focus on inflation control and labor market conditions.
Criticisms and Limitations of Each Curve
The Laffer curve faces criticism for its oversimplification of the relationship between tax rates and government revenue, often disregarding economic, social, and behavioral complexities influencing tax compliance and economic growth. The Phillips curve is limited by its historical failure to consistently predict the inverse relationship between unemployment and inflation, especially during periods of stagflation, when both rates rise simultaneously. Both curves often rely on assumptions that may not hold true across different economic contexts, making their application and policy implications potentially misleading or incomplete.
Comparative Analysis and Real-World Applications
The Laffer Curve illustrates the relationship between tax rates and tax revenue, emphasizing optimal taxation levels to maximize government income without discouraging productivity, while the Phillips Curve demonstrates the inverse relationship between unemployment and inflation, guiding monetary policy decisions. Real-world applications of the Laffer Curve influence fiscal policy by helping governments determine tax cuts or increases to stimulate economic growth, whereas the Phillips Curve assists central banks in balancing inflation control and employment stability. Comparative analysis highlights that both models address trade-offs in economic policy but differ in scope: the Laffer Curve focuses on tax-revenue dynamics, and the Phillips Curve focuses on labor market inflation interactions.
Laffer curve Infographic