Allocative efficiency occurs when resources are distributed in a way that maximizes consumer satisfaction and meets society's needs optimally. This economic state ensures that goods and services are produced in quantities aligned with consumer preferences, minimizing waste and enhancing overall welfare. Discover how allocative efficiency impacts markets and why understanding it is crucial for Your economic insights in the full article.
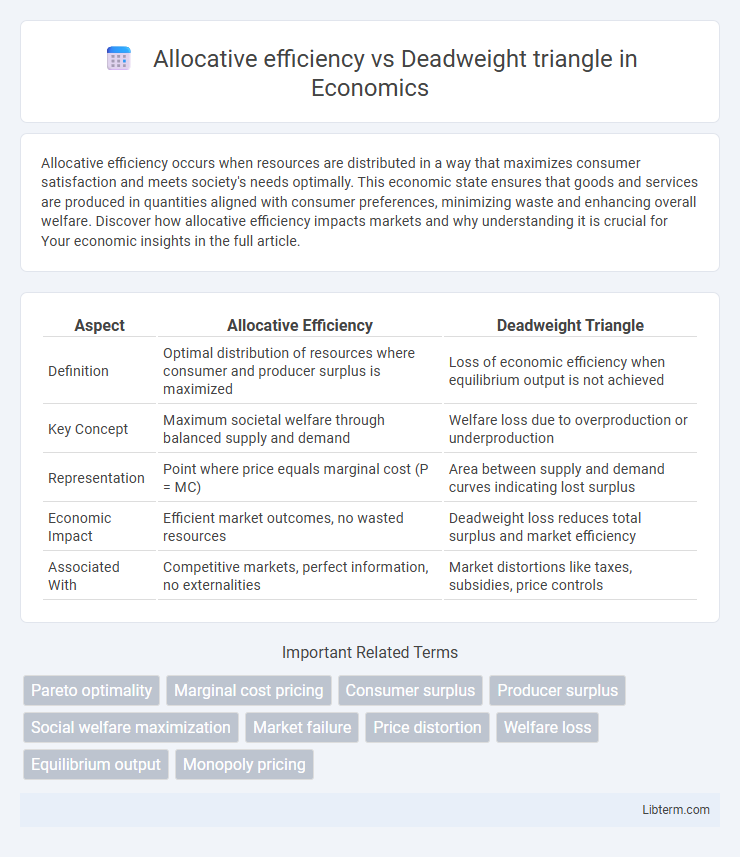
Table of Comparison
| Aspect | Allocative Efficiency | Deadweight Triangle |
|---|---|---|
| Definition | Optimal distribution of resources where consumer and producer surplus is maximized | Loss of economic efficiency when equilibrium output is not achieved |
| Key Concept | Maximum societal welfare through balanced supply and demand | Welfare loss due to overproduction or underproduction |
| Representation | Point where price equals marginal cost (P = MC) | Area between supply and demand curves indicating lost surplus |
| Economic Impact | Efficient market outcomes, no wasted resources | Deadweight loss reduces total surplus and market efficiency |
| Associated With | Competitive markets, perfect information, no externalities | Market distortions like taxes, subsidies, price controls |
Introduction to Allocative Efficiency and Deadweight Triangle
Allocative efficiency occurs when resources are distributed in a way that maximizes total societal welfare, meaning goods and services are produced according to consumer preferences at an optimal price. The deadweight triangle represents the loss of economic efficiency resulting from market distortions such as taxes, subsidies, or price controls, causing a reduction in total surplus. Understanding allocative efficiency and the deadweight triangle helps in analyzing how market interventions impact welfare by creating inefficiencies in resource allocation.
Defining Allocative Efficiency in Economics
Allocative efficiency in economics occurs when resources are distributed to produce the mix of goods and services most desired by society, reflecting consumer preferences and maximizing total welfare. The deadweight triangle represents the loss in social surplus due to inefficiencies like taxes, subsidies, or market distortions that prevent achieving allocative efficiency. In perfectly competitive markets, allocative efficiency is achieved where price equals marginal cost, minimizing deadweight loss and ensuring optimal resource allocation.
Understanding the Deadweight Triangle Concept
The deadweight triangle represents the loss of economic efficiency when the allocation of resources deviates from the optimal point of allocative efficiency, where marginal cost equals marginal benefit. This triangular area on a supply and demand graph highlights the total surplus lost due to market distortions such as taxes, subsidies, or price controls. Understanding the deadweight triangle concept is crucial for analyzing how policies impact consumer and producer surplus, leading to inefficiencies in resource distribution.
Causes of Allocative Inefficiency
Allocative inefficiency occurs when resources are not distributed to maximize total social welfare, often due to market failures such as monopolies, externalities, and asymmetric information. These causes result in output levels that deviate from the social optimum, creating a deadweight loss represented by the deadweight triangle on supply and demand graphs. This deadweight triangle illustrates the loss of economic efficiency when the quantity of goods produced and consumed is less or more than the allocatively efficient equilibrium.
Market Structures Influencing Deadweight Loss
Allocative efficiency occurs when resources are distributed to maximize total social welfare, achieved when price equals marginal cost in perfectly competitive markets. Deadweight loss, represented by the deadweight triangle, emerges in imperfect market structures such as monopolies or oligopolies, where prices exceed marginal costs, reducing consumer and producer surplus. Market structures with higher market power tend to increase deadweight loss by restricting output below allocatively efficient levels, leading to inefficiencies in resource allocation.
Graphical Representation of Allocative Efficiency
The graphical representation of allocative efficiency is depicted where the demand curve intersects the supply curve, indicating the optimal allocation of resources where consumer and producer surplus are maximized. The deadweight triangle on the graph highlights the loss in total surplus caused by market inefficiencies such as price ceilings, taxes, or monopolistic pricing, reflecting the deviation from allocative efficiency. This triangle represents the net loss to society, visually demonstrating how resource misallocation leads to reduced economic welfare.
Deadweight Triangle in Monopoly and Perfect Competition
The deadweight triangle represents the loss of economic efficiency when monopolies restrict output below the socially optimal level, resulting in higher prices and reduced consumer surplus compared to perfect competition. In perfect competition, firms produce where price equals marginal cost, eliminating deadweight loss and maximizing allocative efficiency. Monopolies create a deadweight triangle by producing less than the competitive equilibrium quantity, causing a net loss of total welfare in the market.
Real-World Examples of Deadweight Loss
Deadweight loss occurs when market outcomes deviate from allocative efficiency, causing a loss of total surplus. Real-world examples include taxes on cigarettes, which reduce consumption below the efficient level, and minimum wage laws that create unemployment by setting wages above equilibrium. These situations illustrate how government interventions or market failures can create a deadweight loss triangle, representing lost economic value.
Policy Interventions to Minimize Deadweight Loss
Policy interventions such as taxes, subsidies, and price controls aim to correct market imperfections and reduce the deadweight triangle, which represents allocative inefficiency where resources are not optimally distributed. Implementing Pigouvian taxes on negative externalities or subsidies on positive externalities aligns private costs or benefits with social costs or benefits, minimizing deadweight loss. Regulatory measures that improve information symmetry and reduce transaction costs also enhance allocative efficiency by moving the market closer to the socially optimal output level.
Comparing and Contrasting Allocative Efficiency vs. Deadweight Triangle
Allocative efficiency occurs when resources are distributed in a way that maximizes total consumer and producer surplus, indicating optimal market output where price equals marginal cost. The deadweight triangle represents the loss of economic efficiency when the market output deviates from the allocatively efficient level, often caused by taxes, subsidies, or monopolies creating excess or shortage in supply or demand. Comparing both concepts highlights that allocative efficiency is the benchmark of ideal resource allocation, whereas the deadweight triangle quantifies the welfare loss resulting from inefficient resource allocation.
Allocative efficiency Infographic