The Phillips Curve illustrates the inverse relationship between unemployment and inflation in an economy, showing how lower unemployment can lead to higher inflation rates. Policymakers often use this concept to balance economic growth with price stability, adjusting strategies based on current labor market conditions and inflation expectations. Discover how understanding the Phillips Curve can help you navigate economic trends by reading the full article.
Table of Comparison
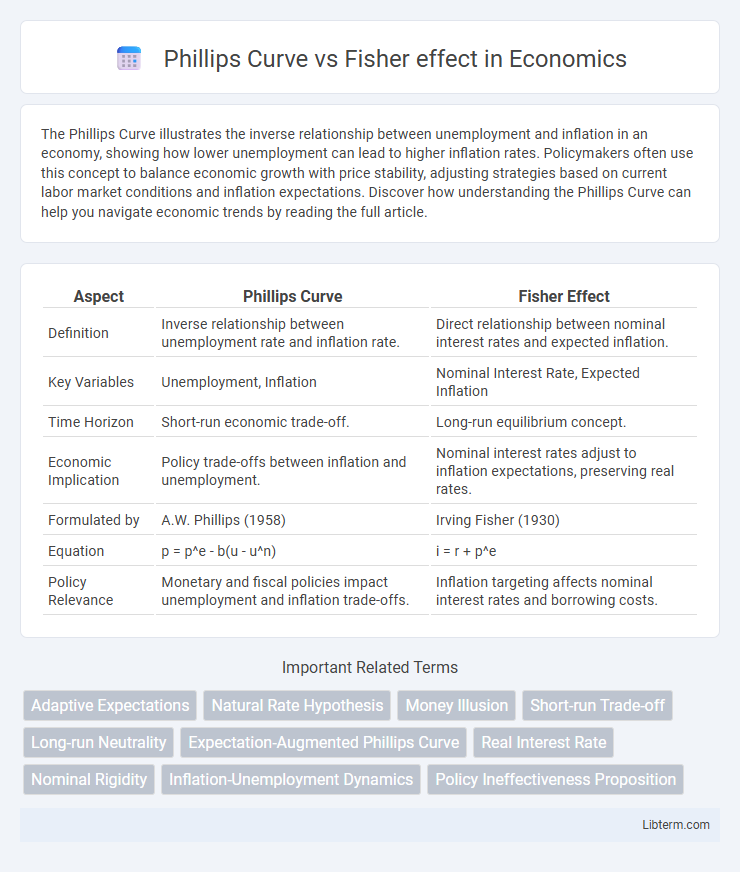
| Aspect | Phillips Curve | Fisher Effect |
|---|---|---|
| Definition | Inverse relationship between unemployment rate and inflation rate. | Direct relationship between nominal interest rates and expected inflation. |
| Key Variables | Unemployment, Inflation | Nominal Interest Rate, Expected Inflation |
| Time Horizon | Short-run economic trade-off. | Long-run equilibrium concept. |
| Economic Implication | Policy trade-offs between inflation and unemployment. | Nominal interest rates adjust to inflation expectations, preserving real rates. |
| Formulated by | A.W. Phillips (1958) | Irving Fisher (1930) |
| Equation | p = p^e - b(u - u^n) | i = r + p^e |
| Policy Relevance | Monetary and fiscal policies impact unemployment and inflation trade-offs. | Inflation targeting affects nominal interest rates and borrowing costs. |
Introduction to the Phillips Curve and Fisher Effect
The Phillips Curve illustrates the inverse short-run relationship between inflation and unemployment, suggesting that lower unemployment can lead to higher inflation due to increased wage demands. The Fisher Effect emphasizes the long-run relationship, asserting that nominal interest rates adjust to expected inflation, maintaining a consistent real interest rate regardless of inflation changes. Understanding both concepts is crucial for analyzing monetary policy impacts on inflation, unemployment, and interest rates dynamics.
Historical Background of Both Theories
The Phillips Curve, introduced by A.W. Phillips in 1958, historically depicted an inverse relationship between unemployment and inflation based on UK wage data from 1861 to 1957. In contrast, Irving Fisher's Fisher Effect, proposed in the 1930s, emphasized the long-term relationship between nominal interest rates and expected inflation, asserting that nominal rates adjust to reflect inflation expectations. Both theories emerged from empirical observations but addressed inflation dynamics from different economic perspectives and time horizons.
Theoretical Foundations: Phillips Curve Explained
The Phillips Curve illustrates an inverse relationship between inflation and unemployment, suggesting that lower unemployment rates tend to accompany higher inflation due to increased wage demands. Rooted in Keynesian economics, it emphasizes short-run trade-offs where policymakers can target employment levels at the cost of rising prices. This framework contrasts with the Fisher effect, which posits that nominal interest rates adjust one-for-one with expected inflation, reflecting long-term neutrality between inflation and real economic variables.
Theoretical Foundations: Fisher Effect Explained
The Fisher Effect theorizes that nominal interest rates adjust one-to-one with expected inflation, maintaining a constant real interest rate over time. Irving Fisher's model emphasizes the separation of real and nominal components, where expected inflation is fully incorporated into nominal rates, reflecting the true cost of borrowing. This contrasts with the Phillips Curve, which focuses on the short-run inverse relationship between inflation and unemployment, rather than interest rate dynamics.
Key Differences Between Phillips Curve and Fisher Effect
The Phillips Curve illustrates an inverse relationship between inflation and unemployment, suggesting that lower unemployment leads to higher inflation. The Fisher Effect describes how nominal interest rates adjust one-for-one with changes in expected inflation, maintaining real interest rates constant. Unlike the Phillips Curve, which emphasizes trade-offs in the short run, the Fisher Effect focuses on long-term equilibrium in interest rates and inflation expectations.
Influence of Inflation on Unemployment and Interest Rates
The Phillips Curve illustrates an inverse relationship between inflation and unemployment, suggesting that higher inflation typically leads to lower unemployment in the short run. The Fisher Effect emphasizes the direct correlation between expected inflation and nominal interest rates, indicating that nominal interest rates adjust to reflect changes in inflation expectations while real interest rates remain stable. Together, these theories highlight how inflation influences both labor market dynamics and interest rate adjustments in different economic contexts.
Long-Run vs Short-Run Implications
The Phillips Curve illustrates a short-run trade-off between inflation and unemployment, implying that lowering unemployment can temporarily increase inflation. In contrast, the Fisher Effect emphasizes long-run neutrality, where nominal interest rates adjust to expected inflation, leaving real interest rates unchanged over time. While the Phillips Curve loses predictive power in the long run due to adaptive expectations, the Fisher Effect highlights consistent inflation expectations influencing interest rates beyond short-run fluctuations.
Empirical Evidence and Real-World Applications
Empirical evidence shows the Phillips Curve often weakens during periods of stagflation, highlighting its limited predictive power for inflation-unemployment trade-offs in volatile economies. The Fisher effect, supported by long-term data, consistently demonstrates a close relationship between nominal interest rates and expected inflation, making it a vital tool for monetary policy and bond market analysis. Real-world applications use the Phillips Curve primarily for short-term inflation forecasting, while the Fisher effect underpins long-run interest rate adjustments and inflation expectations in financial markets.
Criticisms and Limitations of Each Model
The Phillips Curve faces criticism for its inability to consistently predict inflation-unemployment trade-offs during periods of stagflation and supply shocks, revealing its limitation in accounting for expectations and real economic factors. The Fisher effect is often challenged for assuming a direct one-to-one relationship between nominal interest rates and expected inflation, ignoring the influence of monetary policy, risk premiums, and market imperfections. Both models struggle with incorporating dynamic changes in expectations and structural shifts, limiting their practical accuracy in modern macroeconomic analysis.
Policy Implications and Contemporary Relevance
The Phillips Curve suggests a short-run trade-off between inflation and unemployment, guiding policymakers to target inflation for employment gains, but faces limitations during periods of stagflation. The Fisher effect emphasizes the direct relationship between nominal interest rates and expected inflation, highlighting the importance of inflation expectations in monetary policy and interest rate setting. Contemporary relevance lies in the integration of these theories for policymakers to balance inflation targeting with managing inflation expectations under dynamic economic conditions.
Phillips Curve Infographic