The Environmental Kuznets Curve illustrates the relationship between economic growth and environmental degradation, suggesting that pollution increases during early development stages but decreases as income reaches higher levels. This concept highlights the potential for sustainable development through technological innovation and regulatory policies. Explore the rest of the article to understand how this theory impacts environmental strategies and your role in shaping a greener future.
Table of Comparison
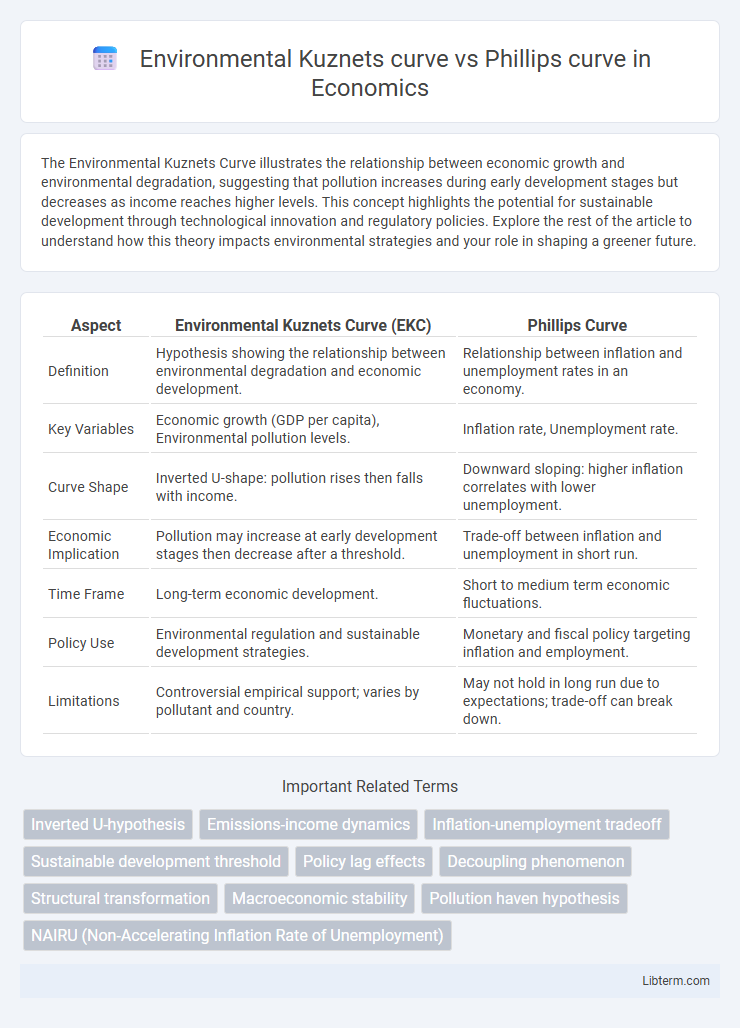
| Aspect | Environmental Kuznets Curve (EKC) | Phillips Curve |
|---|---|---|
| Definition | Hypothesis showing the relationship between environmental degradation and economic development. | Relationship between inflation and unemployment rates in an economy. |
| Key Variables | Economic growth (GDP per capita), Environmental pollution levels. | Inflation rate, Unemployment rate. |
| Curve Shape | Inverted U-shape: pollution rises then falls with income. | Downward sloping: higher inflation correlates with lower unemployment. |
| Economic Implication | Pollution may increase at early development stages then decrease after a threshold. | Trade-off between inflation and unemployment in short run. |
| Time Frame | Long-term economic development. | Short to medium term economic fluctuations. |
| Policy Use | Environmental regulation and sustainable development strategies. | Monetary and fiscal policy targeting inflation and employment. |
| Limitations | Controversial empirical support; varies by pollutant and country. | May not hold in long run due to expectations; trade-off can break down. |
Introduction to Economic Curves
Economic curves like the Environmental Kuznets Curve (EKC) and the Phillips Curve illustrate critical relationships between economic variables and environmental or labor market outcomes. The EKC hypothesizes an inverted U-shape linking economic growth to environmental degradation, suggesting pollution increases up to a certain income level before declining. The Phillips Curve depicts an inverse relationship between unemployment and inflation, highlighting trade-offs in macroeconomic policy decisions.
Understanding the Environmental Kuznets Curve
The Environmental Kuznets Curve (EKC) hypothesizes an inverted U-shaped relationship between environmental degradation and economic growth, suggesting that pollution intensifies during early industrial development but declines as income reaches a higher threshold. Empirical studies utilize data on GDP per capita and various pollution indicators, such as CO2 emissions and deforestation rates, to validate this model across different countries and pollutants. Understanding the EKC is crucial for policymakers to balance economic growth with sustainable environmental management, contrasting with the Phillips curve, which primarily analyzes the trade-off between inflation and unemployment.
Exploring the Phillips Curve
The Phillips curve illustrates the inverse relationship between inflation and unemployment, suggesting that lower unemployment rates often come with higher inflation levels. Unlike the Environmental Kuznets Curve, which explores the link between economic growth and environmental degradation, the Phillips curve focuses on short-term macroeconomic trade-offs in labor markets. Policymakers analyze the Phillips curve to balance inflation control and employment policies, aiming to stabilize the economy without triggering excessive inflation or unemployment.
Historical Development of Both Curves
The Environmental Kuznets Curve (EKC) emerged in the early 1990s, inspired by Kuznets' original income inequality hypothesis, highlighting the inverse relationship between environmental degradation and economic growth as economies transition from industrialization to service sectors. The Phillips Curve was introduced in 1958 by A.W. Phillips, depicting an empirical inverse relationship between unemployment and inflation in the UK, which influenced macroeconomic policy for decades despite later critiques and modifications. Both curves have evolved through extensive empirical studies that challenged their initial simplicity, prompting refinements to capture complex socioeconomic dynamics in environmental economics and monetary policy.
Key Variables in the Environmental Kuznets Curve
The Environmental Kuznets Curve (EKC) primarily focuses on the relationship between environmental degradation and economic growth, with key variables including income per capita, pollution levels, and the stage of economic development. Unlike the Phillips curve, which analyzes inflation and unemployment rates, the EKC emphasizes how environmental impact initially rises with income but eventually falls as economies mature and adopt cleaner technologies. Income distribution, technological innovation, and regulatory policies are critical variables affecting the EKC trajectory.
Core Elements of the Phillips Curve
The Phillips Curve fundamentally illustrates the inverse relationship between inflation and unemployment, highlighting that lower unemployment often leads to higher inflation due to increased demand for labor. Its core elements include the short-run trade-off where wage inflation and unemployment rate fluctuate inversely, and the expectations-augmented component accounting for adaptive or rational expectations that shift the curve over time. Unlike the Environmental Kuznets Curve, which maps economic growth against environmental degradation, the Phillips Curve centers on macroeconomic variables critical to monetary policy decisions.
Comparing Environmental and Economic Impacts
The Environmental Kuznets Curve (EKC) illustrates the relationship between economic growth and environmental degradation, suggesting pollution initially worsens with income growth before improving after a certain income threshold. The Phillips Curve captures the trade-off between inflation and unemployment, representing economic activity impacts but without direct environmental implications. Comparing both, the EKC integrates environmental impacts with economic dynamics, while the Phillips Curve centers purely on economic variables, highlighting different but complementary aspects of sustainable development policy challenges.
Policy Implications: EKC vs Phillips Curve
The Environmental Kuznets Curve (EKC) suggests that economic growth initially leads to environmental degradation, but after reaching a certain income level, further growth results in environmental improvement, guiding policymakers to prioritize sustainable development and investment in green technologies during early growth stages. In contrast, the Phillips Curve illustrates an inverse short-term relationship between unemployment and inflation, prompting monetary authorities to balance inflation control with employment goals, often through interest rate adjustments and fiscal stimulus. Understanding these curves enables tailored policy frameworks: EKC emphasizes long-term environmental and economic trade-offs, while the Phillips Curve requires dynamic management of inflation and labor markets to stabilize the economy.
Criticisms and Debates Surrounding Both Curves
The Environmental Kuznets Curve (EKC) faces criticism for oversimplifying the relationship between economic growth and environmental degradation, often neglecting factors like technological change and policy interventions. The Phillips Curve is debated due to its diminishing empirical correlation between inflation and unemployment, questioning its relevance in modern macroeconomic contexts. Both curves spark discussions on their predictive power and applicability across different economies and time periods, highlighting the complexities of economic-environmental and labor market dynamics.
Future Research Directions and Conclusions
Future research on the Environmental Kuznets Curve (EKC) should explore integrating environmental quality indicators with macroeconomic variables to better capture dynamic feedback mechanisms, while Phillips Curve studies could benefit from incorporating climate-related shocks to inflationary dynamics. Investigating sector-specific impacts and regional heterogeneity in both EKC and Phillips Curve frameworks may reveal nuanced relationships essential for policy formulation. Advancements in econometric techniques and high-frequency environmental and economic data will enhance understanding of the evolving interaction between economic growth, environmental degradation, and inflation.
Environmental Kuznets curve Infographic