A budget line represents all the possible combinations of two goods that you can purchase given your income and prices. It illustrates the trade-offs consumers face when allocating their limited resources to maximize utility. Explore the rest of the article to understand how budget constraints shape your financial decisions.
Table of Comparison
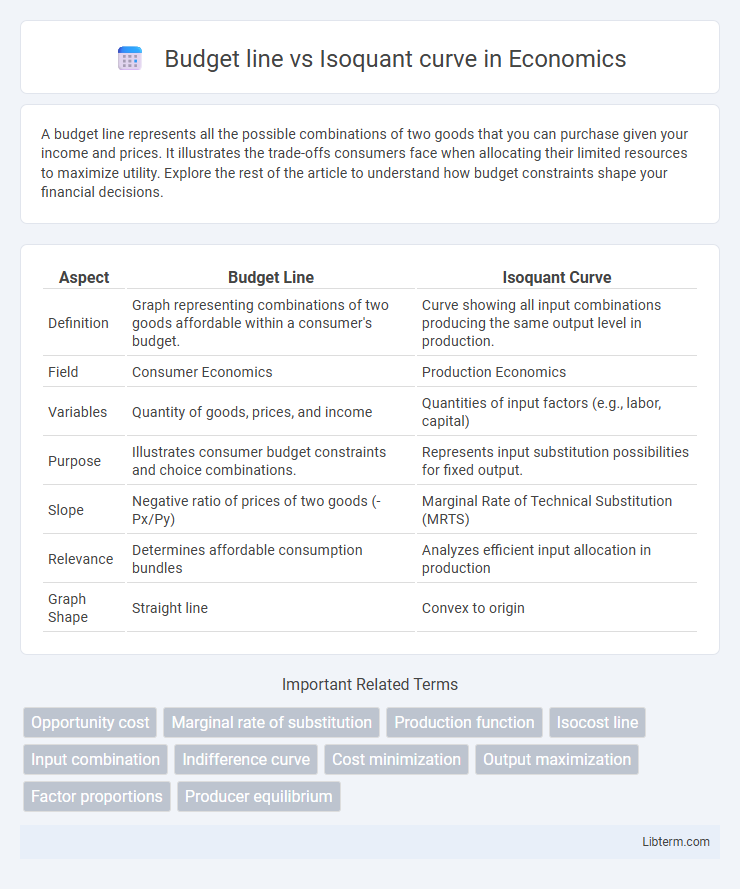
| Aspect | Budget Line | Isoquant Curve |
|---|---|---|
| Definition | Graph representing combinations of two goods affordable within a consumer's budget. | Curve showing all input combinations producing the same output level in production. |
| Field | Consumer Economics | Production Economics |
| Variables | Quantity of goods, prices, and income | Quantities of input factors (e.g., labor, capital) |
| Purpose | Illustrates consumer budget constraints and choice combinations. | Represents input substitution possibilities for fixed output. |
| Slope | Negative ratio of prices of two goods (-Px/Py) | Marginal Rate of Technical Substitution (MRTS) |
| Relevance | Determines affordable consumption bundles | Analyzes efficient input allocation in production |
| Graph Shape | Straight line | Convex to origin |
Introduction to Budget Line and Isoquant Curve
The budget line represents all possible combinations of two goods that a consumer can purchase given their income and prices, illustrating the trade-off between these goods under a fixed budget constraint. The isoquant curve depicts different combinations of two inputs, such as labor and capital, that produce the same level of output, highlighting the substitutability of inputs in production. Both concepts are fundamental in microeconomics, with the budget line used in consumer choice theory and the isoquant curve applied in production theory.
Definition of Budget Line
A budget line represents all combinations of two goods that a consumer can purchase given their income and the prices of those goods, illustrating the consumer's purchasing power constraints. Unlike an isoquant curve, which shows combinations of inputs that yield the same output in production theory, the budget line focuses on consumption possibilities within a fixed budget. Understanding the budget line is essential for analyzing consumer choice and optimizing utility under budget constraints.
Definition of Isoquant Curve
An isoquant curve represents all combinations of two inputs, such as labor and capital, that produce the same level of output in production. Unlike the budget line, which shows combinations of inputs affordable within a given cost constraint, the isoquant curve reflects equal output quantities regardless of cost. Understanding isoquant curves is essential for analyzing production efficiency and optimal input substitution.
Key Differences Between Budget Line and Isoquant Curve
The budget line represents all combinations of two goods a consumer can purchase given their income and prices, while the isoquant curve depicts all combinations of two inputs that produce the same level of output. Budget lines are linear because prices are constant, whereas isoquants are typically convex due to diminishing marginal returns in production. Unlike budget lines that relate to consumer choices and monetary constraints, isoquant curves are used in production theory to analyze input substitution and efficiency.
Graphical Representation of Budget Line
The graphical representation of a budget line is a straight line illustrating all possible combinations of two goods that a consumer can purchase given their income and the prices of the goods. It slopes downward, reflecting the trade-off between the quantities of the two goods due to a fixed budget. In contrast, an isoquant curve represents different combinations of inputs producing the same level of output, typically depicted as a convex curve on an input graph.
Graphical Representation of Isoquant Curve
The graphical representation of an isoquant curve illustrates combinations of two inputs, such as labor and capital, that produce the same level of output. Unlike the budget line, which shows combinations of inputs affordable given a budget constraint, the isoquant curve is typically convex to the origin, reflecting diminishing marginal rates of technical substitution. This curve enables firms to identify optimal input combinations for efficient production at a fixed output level.
Budget Constraints vs Production Possibilities
Budget lines represent budget constraints that illustrate the maximum combinations of goods consumers can afford given their income and prices, defining feasible consumption bundles. Isoquant curves depict production possibilities by showing all combinations of inputs that yield the same output level, highlighting efficient input utilization. While budget lines emphasize financial limits on consumption, isoquant curves focus on technological constraints in production processes.
Applications in Consumer Theory and Production Theory
The budget line represents all combinations of goods a consumer can purchase given income and prices, essential for analyzing consumer choice and utility maximization in Consumer Theory. The isoquant curve illustrates different input combinations yielding the same output level, crucial for understanding production efficiency and cost minimization in Production Theory. Together, these concepts optimize resource allocation by balancing consumer preferences with firm production capabilities.
Practical Examples: Budget Line vs Isoquant Curve
A budget line represents all possible combinations of two goods a consumer can afford given their income and prices, such as choosing between coffee and sandwiches within a $10 budget. An isoquant curve illustrates different combinations of inputs, like labor and capital, that produce the same output level in production, such as various workforce-machine mixes that yield 100 units of a product. For instance, a bakery may use the budget line to decide between flour and sugar purchases while also using an isoquant curve to determine the optimal mix of ovens and bakers to maintain consistent daily production.
Summary and Conclusion
The budget line represents all possible combinations of goods that a consumer can purchase given their income and prices, highlighting financial constraints. The isoquant curve illustrates combinations of inputs that yield the same level of output, emphasizing production efficiency. Together, these concepts contrast consumer choice under budget limits with firm's input substitution decisions under production goals, providing insight into economic optimization.
Budget line Infographic