The production possibility frontier (PPF) illustrates the maximum output combinations a society can achieve using available resources and technology, reflecting opportunity costs and economic efficiency. It highlights trade-offs and helps determine the most efficient allocation of resources to maximize production. Explore the rest of the article to understand how the PPF impacts decision-making and economic growth.
Table of Comparison
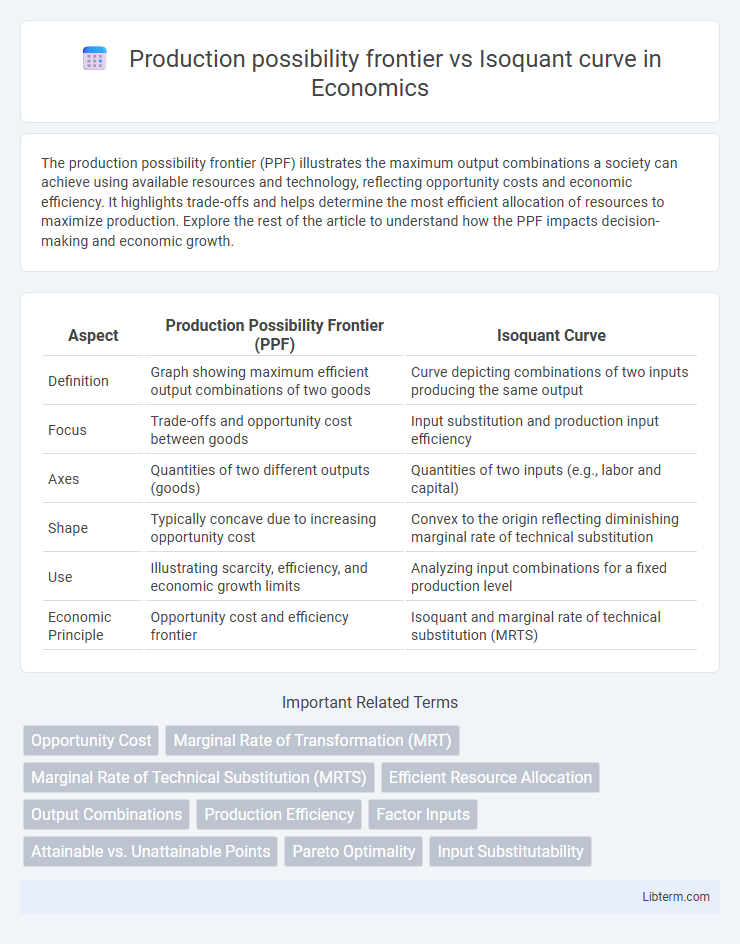
| Aspect | Production Possibility Frontier (PPF) | Isoquant Curve |
|---|---|---|
| Definition | Graph showing maximum efficient output combinations of two goods | Curve depicting combinations of two inputs producing the same output |
| Focus | Trade-offs and opportunity cost between goods | Input substitution and production input efficiency |
| Axes | Quantities of two different outputs (goods) | Quantities of two inputs (e.g., labor and capital) |
| Shape | Typically concave due to increasing opportunity cost | Convex to the origin reflecting diminishing marginal rate of technical substitution |
| Use | Illustrating scarcity, efficiency, and economic growth limits | Analyzing input combinations for a fixed production level |
| Economic Principle | Opportunity cost and efficiency frontier | Isoquant and marginal rate of technical substitution (MRTS) |
Introduction to Production Possibility Frontier and Isoquant Curve
The Production Possibility Frontier (PPF) illustrates the maximum feasible output combinations of two goods that an economy can achieve given fixed resources and technology, emphasizing opportunity cost and efficiency. An Isoquant Curve represents combinations of different inputs, such as labor and capital, that produce a specific level of output, highlighting input substitution and production efficiency. Both concepts are fundamental tools in production theory, with PPF focusing on output trade-offs at the macroeconomic level, while Isoquants analyze input combinations at the microeconomic firm level.
Defining the Production Possibility Frontier (PPF)
The Production Possibility Frontier (PPF) represents the maximum possible output combinations of two goods or services an economy can achieve using available resources and technology efficiently. It illustrates the trade-offs and opportunity costs when reallocating resources between different production activities. Unlike the Isoquant curve, which focuses on input combinations to produce a specific output level, the PPF emphasizes the boundary of feasible total production capacities in an economy.
Understanding the Isoquant Curve
The Isoquant curve represents combinations of different inputs that produce the same level of output, illustrating the trade-offs in input usage for efficient production. Unlike the Production Possibility Frontier (PPF), which shows the maximum output combinations of two goods given limited resources, the Isoquant specifically focuses on input factors within a single production process. Understanding the Isoquant curve aids in optimizing input allocation to achieve a desired production level while minimizing costs.
Key Assumptions of PPF and Isoquant Analysis
The Production Possibility Frontier (PPF) assumes fixed resources, full employment, and efficient production, highlighting the trade-offs and opportunity costs between two goods. Isoquant curves assume variable inputs with a constant output level, representing combinations of labor and capital while emphasizing input substitutability. Both models rely on the assumption of technological efficiency, but PPF focuses on output limitations, whereas isoquants analyze input combinations for cost minimization.
Graphical Representation: PPF vs Isoquant Curve
The Production Possibility Frontier (PPF) graphically represents the maximum output combinations of two goods that an economy can produce given fixed resources and technology, typically displayed as a bowed-out curve demonstrating opportunity costs. In contrast, the Isoquant curve illustrates all possible input combinations, such as labor and capital, that yield the same level of production for a single good, appearing as a smooth, convex curve toward the origin. While the PPF emphasizes trade-offs between different goods at the macro level, the Isoquant focuses on input substitution efficiency at the production unit level.
Economic Interpretation: Opportunity Cost and Input Substitution
The Production Possibility Frontier (PPF) illustrates opportunity cost by showing the trade-offs between producing two goods, highlighting how allocating resources to one good reduces the quantity available for the other. The Isoquant curve represents different combinations of inputs that yield the same level of output, emphasizing input substitution and the rate at which one input can replace another without changing production levels. While the PPF focuses on opportunity cost in output space, the Isoquant curve concentrates on input substitution within the production process.
Efficiency Concepts: Productive vs Technical Efficiency
The Production Possibility Frontier (PPF) illustrates productive efficiency by showing the maximum output combinations of two goods that an economy can achieve using all resources fully. The Isoquant curve represents technical efficiency in production, where inputs are combined in optimal proportions to produce a given level of output without waste. While the PPF focuses on overall resource allocation efficiency at the macro level, the Isoquant emphasizes input substitution and cost minimization at the micro production level.
Application in Resource Allocation and Production Planning
The Production Possibility Frontier (PPF) illustrates the maximum feasible output combinations of two goods given fixed resources, aiding in macro-level resource allocation by identifying opportunity costs and efficient production points. Isoquant curves, on the other hand, represent different combinations of inputs yielding the same output, facilitating micro-level production planning by optimizing input use to minimize costs while maintaining output levels. Both tools enhance decision-making in resource allocation and production efficiency, with the PPF guiding overall capacity limits and isoquants supporting detailed input substitution strategies.
Differences Between PPF and Isoquant Curve
The Production Possibility Frontier (PPF) illustrates the maximum output combinations of two goods that an economy can produce given fixed resources and technology, emphasizing opportunity costs and trade-offs. In contrast, the Isoquant curve represents different combinations of two inputs, such as labor and capital, that yield the same level of output for a single product, highlighting input substitution and production efficiency. While PPF deals with output limits at the macroeconomic level, Isoquant curves focus on the microeconomic production process and input optimization.
Conclusion: Choosing the Right Tool for Economic Analysis
The Production Possibility Frontier (PPF) effectively illustrates the trade-offs and opportunity costs between two goods at the macroeconomic level, aiding in resource allocation decisions. Isoquant curves provide detailed insights into the combinations of inputs to produce a given output, optimizing production efficiency within firms. Selecting the appropriate tool depends on whether the analysis targets overall production capacity or input substitution in microeconomic production processes.
Production possibility frontier Infographic