The Security Characteristic Line (SCL) graphically represents the relationship between a security's excess returns and the market's excess returns, helping investors assess its systematic risk and performance relative to the market. By analyzing the slope of the SCL, known as beta, you can determine the sensitivity of a security's returns to market movements, which is crucial for portfolio risk management. Explore the rest of the article to understand how the SCL can enhance your investment decision-making process.
Table of Comparison
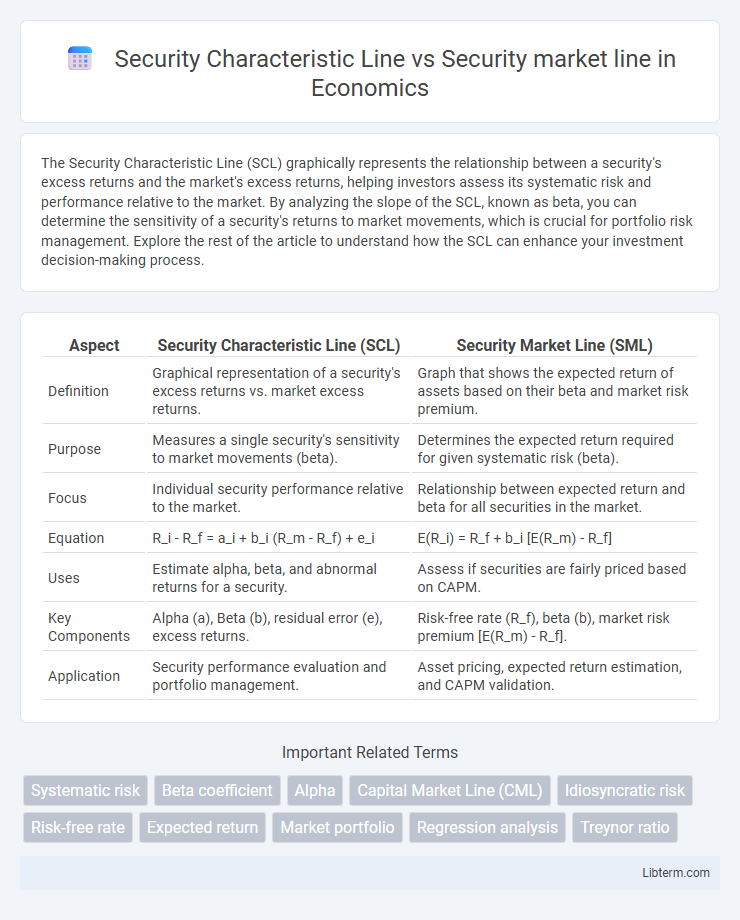
| Aspect | Security Characteristic Line (SCL) | Security Market Line (SML) |
|---|---|---|
| Definition | Graphical representation of a security's excess returns vs. market excess returns. | Graph that shows the expected return of assets based on their beta and market risk premium. |
| Purpose | Measures a single security's sensitivity to market movements (beta). | Determines the expected return required for given systematic risk (beta). |
| Focus | Individual security performance relative to the market. | Relationship between expected return and beta for all securities in the market. |
| Equation | R_i - R_f = a_i + b_i (R_m - R_f) + e_i | E(R_i) = R_f + b_i [E(R_m) - R_f] |
| Uses | Estimate alpha, beta, and abnormal returns for a security. | Assess if securities are fairly priced based on CAPM. |
| Key Components | Alpha (a), Beta (b), residual error (e), excess returns. | Risk-free rate (R_f), beta (b), market risk premium [E(R_m) - R_f]. |
| Application | Security performance evaluation and portfolio management. | Asset pricing, expected return estimation, and CAPM validation. |
Introduction to Security Characteristic Line (SCL)
The Security Characteristic Line (SCL) represents the relationship between an individual security's excess returns and the excess returns of the market portfolio, providing a graphical depiction of the asset's beta coefficient. It is derived through a regression of the security's returns against the market returns, illustrating how sensitive the security is to market movements and allowing investors to assess systematic risk. Unlike the Security Market Line (SML), which plots expected returns against beta for all assets, the SCL focuses specifically on the performance characteristics of a single security relative to the market.
Overview of Security Market Line (SML)
The Security Market Line (SML) represents the relationship between systematic risk, measured by beta, and expected return for individual securities or portfolios in the Capital Asset Pricing Model (CAPM). It displays the market's risk-return trade-off, where the slope equals the market risk premium and the intercept corresponds to the risk-free rate. Investors use the SML to evaluate whether a security offers a favorable expected return relative to its risk, distinguishing it from the Security Characteristic Line (SCL), which plots a security's excess return against the market's excess return for performance analysis.
Definition and Components of SCL
The Security Characteristic Line (SCL) represents the relationship between the excess returns of a specific security and the excess returns of the market portfolio, capturing the security's systematic risk measured by its beta. Its components include the security's alpha (intercept), beta (slope), and the residual error term reflecting unsystematic risk. The Security Market Line (SML) depicts the expected return of assets as a function of their beta, providing a benchmark for evaluating whether a security offers adequate expected returns for its risk level.
Understanding the SML Equation
The Security Market Line (SML) equation, represented as E(R_i) = R_f + b_i (E(R_m) - R_f), illustrates the expected return of a security based on its beta relative to the overall market risk premium. In contrast, the Security Characteristic Line (SCL) plots actual security returns against market returns, highlighting a specific asset's beta and alpha through regression analysis. Understanding the SML equation is crucial for evaluating if a security's return is consistent with its systematic risk, as measured by beta, within the Capital Asset Pricing Model (CAPM) framework.
Key Differences: SCL vs SML
The Security Characteristic Line (SCL) represents the relationship between an individual security's excess returns and the overall market's excess returns, highlighting the security's beta as a measure of systematic risk. In contrast, the Security Market Line (SML) illustrates the expected return of an asset as a function of its beta in the Capital Asset Pricing Model (CAPM), providing a benchmark for evaluating investment performance. Key differences include SCL's empirical focus on historical returns for a single asset, while SML serves as a theoretical market-wide model showing risk-return trade-offs.
Role of Beta in SCL and SML
The Security Characteristic Line (SCL) represents the relationship between an individual security's excess returns and the market's excess returns, with beta serving as the slope coefficient that quantifies the security's systematic risk relative to the market. In contrast, the Security Market Line (SML) graphically depicts the expected return of securities as a function of their beta, illustrating the trade-off between risk and return in the Capital Asset Pricing Model (CAPM). Beta in the SCL measures actual sensitivity of returns to market movements, while beta in the SML serves as the key input linking risk to expected return.
Practical Applications of SCL
The Security Characteristic Line (SCL) is crucial for assessing an individual asset's performance relative to market movements by plotting excess returns against excess market returns, facilitating precise beta estimation for portfolio risk management. SCL enables investors to identify security-specific risk premiums beyond market risk, aiding in performance attribution and active portfolio adjustments. This practical application contrasts with the Security Market Line (SML), which provides a benchmark for expected returns based on systematic risk, primarily used for asset pricing and evaluating whether securities are fairly valued.
Practical Applications of SML
The Security Market Line (SML) serves as a crucial tool for investors to evaluate the expected return of assets given their beta, facilitating portfolio optimization and risk assessment. Unlike the Security Characteristic Line (SCL), which graphically represents the relationship between an individual security's excess returns and market excess returns, the SML provides a benchmark for pricing risk-adjusted assets in the Capital Asset Pricing Model (CAPM). Practical applications of the SML include estimating cost of equity, identifying mispriced securities, and guiding capital budgeting decisions by comparing actual returns to those predicted by the market risk.
Limitations of SCL and SML
The Security Characteristic Line (SCL) primarily measures the relationship between an individual asset's excess returns and the market excess returns, limiting its scope to historical beta estimation and failing to account for changing market conditions or investor sentiment. In contrast, the Security Market Line (SML) represents the risk-return tradeoff for all assets based on the Capital Asset Pricing Model (CAPM), but it assumes a single-period model, market efficiency, and normally distributed returns, which may not hold in real-world scenarios. Both SCL and SML face limitations in capturing dynamic risk factors, ignoring multi-factor risks, and relying on assumptions that may reduce their practical accuracy in complex financial markets.
Conclusion: SCL vs SML in Portfolio Analysis
The Security Characteristic Line (SCL) measures an individual asset's return sensitivity relative to market returns, reflecting its alpha and beta, while the Security Market Line (SML) represents the expected return of assets given their systematic risk (beta) based on the Capital Asset Pricing Model (CAPM). In portfolio analysis, the SCL provides insights into specific security performance and risk-adjusted returns, whereas the SML offers a benchmark for evaluating whether a portfolio's expected return compensates adequately for its market risk. Comparing SCL and SML helps investors identify mispriced securities and optimize portfolio allocation by balancing alpha generation and systematic risk exposure.
Security Characteristic Line Infographic