The S-curve effect describes the pattern of slow initial growth followed by rapid acceleration and eventual plateau in various processes like technology adoption, business development, and learning curves. Understanding this phenomenon helps you anticipate challenges and optimize strategies for sustained success. Explore the rest of the article to learn how to leverage the S-curve effect in your projects and decisions.
Table of Comparison
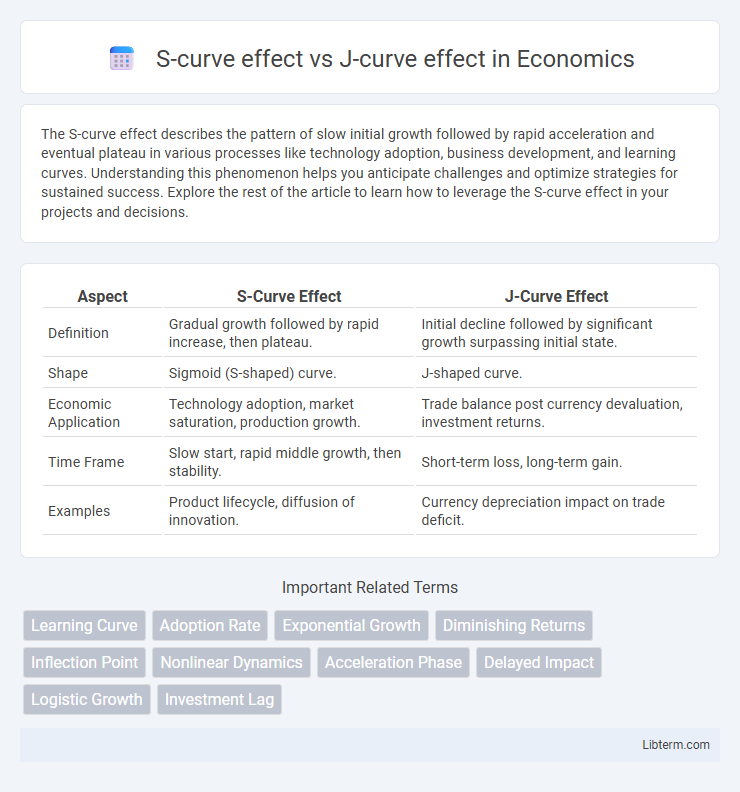
| Aspect | S-Curve Effect | J-Curve Effect |
|---|---|---|
| Definition | Gradual growth followed by rapid increase, then plateau. | Initial decline followed by significant growth surpassing initial state. |
| Shape | Sigmoid (S-shaped) curve. | J-shaped curve. |
| Economic Application | Technology adoption, market saturation, production growth. | Trade balance post currency devaluation, investment returns. |
| Time Frame | Slow start, rapid middle growth, then stability. | Short-term loss, long-term gain. |
| Examples | Product lifecycle, diffusion of innovation. | Currency depreciation impact on trade deficit. |
Understanding the S-Curve Effect
The S-curve effect illustrates a gradual acceleration, rapid growth, and eventual plateau in processes like technology adoption or business growth, emphasizing phases of slow start, exponential progress, and maturity. This model helps in forecasting performance improvements and identifying when innovation reaches saturation points. Understanding the S-curve effect enables strategic planning by anticipating shifts in growth dynamics and allocating resources efficiently during different lifecycle stages.
Exploring the J-Curve Effect
The J-curve effect illustrates an initial decline in performance or outcomes followed by a significant and sustained improvement, commonly observed in economic reforms or investment returns. This effect signifies that short-term losses or setbacks are often necessary precursors to long-term gains, contrasting with the steady growth pattern of the S-curve effect. Understanding the J-curve is crucial for policymakers and investors to anticipate temporary declines before achieving accelerated progress.
Key Differences Between S-Curve and J-Curve
The S-curve effect illustrates a gradual growth phase followed by rapid acceleration and eventual plateauing, reflecting how technologies or products mature over time. In contrast, the J-curve effect depicts an initial decline or loss before a sharp upturn, often used in economics and investments to show recovery after setbacks. Key differences include the S-curve's smooth progression and saturation point versus the J-curve's early trough and subsequent exponential rise.
Applications of the S-Curve in Business and Economics
The S-curve effect models growth patterns where progress starts slowly, accelerates rapidly, and then plateaus, making it vital for forecasting product life cycles, market adoption, and innovation diffusion in business. Companies leverage the S-curve to optimize resource allocation during early-stage development and anticipate maturation phases for strategic repositioning. In economics, the S-curve helps analyze investment returns and economic development stages, guiding policy decisions and growth interventions effectively.
Real-World Examples of the J-Curve Effect
The J-curve effect is often observed in economic recoveries like post-recession GDP growth, where initial declines are followed by rapid improvement, such as Japan's economic rebound after the early 1990s asset bubble burst. In international finance, currency depreciation initially worsens a country's trade balance before improving it, demonstrated by the United Kingdom after the 1992 Black Wednesday devaluation. Political science also cites the J-curve in societal stability, where rising dissatisfaction precedes reforms that ultimately strengthen regimes, as seen in the late 1980s Eastern European revolutions.
Visualizing Growth: S-Curve vs J-Curve
Visualizing growth reveals distinct patterns between the S-curve and J-curve effects, where the S-curve illustrates gradual initial progress followed by rapid acceleration and eventual plateau as saturation is reached. The J-curve depicts a sharper exponential growth trajectory after a delayed start, often reflecting investments or efforts with late but substantial returns. These patterns aid in forecasting project outcomes, investment strategies, and lifecycle stages in business or technology adoption.
Impact on Investment Returns: S-Curve vs J-Curve
The S-curve effect in investment returns illustrates a gradual initial growth phase followed by acceleration and eventual plateau, reflecting steady value creation over time. In contrast, the J-curve effect depicts an early dip in returns due to initial costs and losses before sharply rising as investments mature and generate profits. Understanding these patterns is crucial for private equity and venture capital investors to manage expectations and optimize timing for capital deployment and exit strategies.
S-Curve and J-Curve in Project Management
In project management, the S-curve effect depicts the gradual start, rapid progress, and eventual slowdown of project activities, visually representing cumulative costs, labor hours, or production output over time. The J-curve effect illustrates a project's initial decline or increased expenditures followed by significant improvement or return, often seen in change management or investments. Understanding these curves helps managers optimize resource allocation, predict project performance, and mitigate risks associated with project timelines and deliverables.
Implications for Policy and Strategic Planning
The S-curve effect illustrates a gradual adoption or growth pattern reaching maturity, guiding policymakers to allocate resources progressively and anticipate saturation points for sustainable development. The J-curve effect highlights initial deterioration followed by rapid improvement, prompting strategic planning to brace for short-term setbacks while aiming for long-term gains. Understanding these curves' dynamics aids in designing adaptive policies and investment strategies that balance risk management with growth opportunities.
Choosing the Right Model: S-Curve or J-Curve?
Choosing the right model between the S-curve and J-curve depends on understanding their distinct growth patterns; the S-curve represents gradual growth followed by saturation, ideal for predictable market adoption scenarios, while the J-curve illustrates rapid initial decline followed by exponential growth, often seen in turnaround investments or startups. Analyzing industry lifecycle, risk tolerance, and expected performance timelines enables decision-makers to align strategy with the appropriate model. Accurate model selection optimizes resource allocation and improves forecasting accuracy in investment and innovation management.
S-curve effect Infographic