The Engel curve illustrates the relationship between a consumer's income and their expenditure on a particular good, revealing how spending patterns shift as income changes. Understanding this curve helps businesses and economists predict demand changes for products at different income levels. Explore the rest of the article to deepen your knowledge of how Engel curves influence consumer behavior and market strategies.
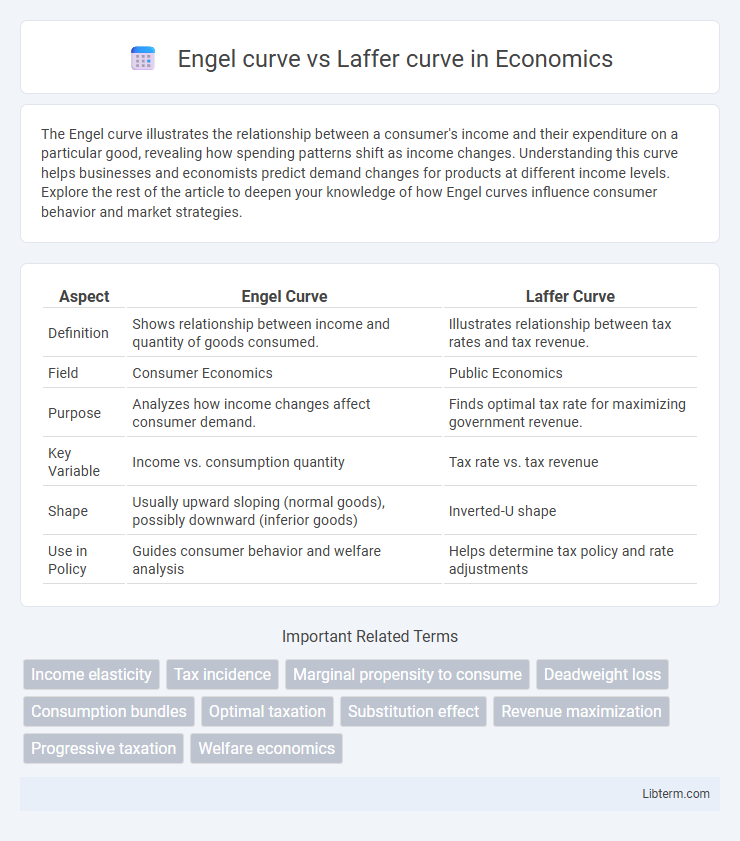
Table of Comparison
| Aspect | Engel Curve | Laffer Curve |
|---|---|---|
| Definition | Shows relationship between income and quantity of goods consumed. | Illustrates relationship between tax rates and tax revenue. |
| Field | Consumer Economics | Public Economics |
| Purpose | Analyzes how income changes affect consumer demand. | Finds optimal tax rate for maximizing government revenue. |
| Key Variable | Income vs. consumption quantity | Tax rate vs. tax revenue |
| Shape | Usually upward sloping (normal goods), possibly downward (inferior goods) | Inverted-U shape |
| Use in Policy | Guides consumer behavior and welfare analysis | Helps determine tax policy and rate adjustments |
Understanding the Engel Curve
The Engel curve illustrates the relationship between a consumer's income and their expenditure on a particular good, highlighting how demand changes as income rises. This curve is essential for understanding consumer behavior, showing whether a good is a necessity or luxury based on the income elasticity of demand. In contrast, the Laffer curve represents the relationship between tax rates and tax revenue, focusing on fiscal policy rather than consumer spending patterns.
Defining the Laffer Curve
The Laffer Curve illustrates the relationship between tax rates and tax revenue, demonstrating that increasing tax rates beyond a certain point can reduce total revenue by discouraging work and investment. It is a fundamental concept in supply-side economics, emphasizing optimal taxation levels to maximize government revenue without impairing economic growth. Unlike the Engel Curve, which depicts consumer spending patterns relative to income, the Laffer Curve focuses on fiscal policy and taxation efficiency.
Historical Origins of the Engel and Laffer Curves
The Engel curve, developed by Ernst Engel in the 19th century, illustrates the relationship between household income and expenditure on a particular good, providing key insights in consumer behavior and demand theory. The Laffer curve, popularized by economist Arthur Laffer in the 1970s, represents the relationship between tax rates and tax revenue, highlighting the concept that beyond a certain point, higher tax rates can reduce government revenue. Both curves have historical significance in economic analysis, with the Engel curve rooted in empirical consumer studies in the industrial age and the Laffer curve emerging from modern fiscal policy debates.
Mathematical Representation of Engel and Laffer Curves
The Engel curve is mathematically expressed as \( Q = f(I, p) \), where \( Q \) represents the quantity demanded of a good, \( I \) denotes income levels, and \( p \) is the price of the good, often showing a positive relationship between income and quantity demanded for normal goods. The Laffer curve is represented by a quadratic function \( T = t \times B(t) \), with \( T \) as total tax revenue, \( t \) as the tax rate, and \( B(t) \) as the tax base dependent on \( t \), illustrating that tax revenue first increases and then decreases with higher tax rates. Both curves use functions to model economic behavior: Engel curves capture consumer demand changes with income variations, while Laffer curves depict government revenue responses to tax rate adjustments.
Key Differences: Engel Curve vs Laffer Curve
The Engel curve illustrates the relationship between a consumer's income and their expenditure on a particular good, highlighting how spending varies with income changes. In contrast, the Laffer curve depicts the relationship between tax rates and tax revenue, emphasizing the optimal tax rate to maximize government revenue without discouraging productivity. While the Engel curve centers on consumer behavior and demand elasticity, the Laffer curve focuses on fiscal policy and supply-side economics.
Economic Implications of Each Curve
The Engel curve illustrates how consumer demand for a good changes with income, highlighting consumption patterns and informing tax policies that affect income distribution. The Laffer curve demonstrates the relationship between tax rates and tax revenue, emphasizing the economic impact of taxation on labor supply and government budget optimization. Understanding both curves aids policymakers in designing fiscal strategies that balance consumer welfare with efficient revenue generation.
Real-World Applications: Consumption vs Taxation
The Engel curve illustrates the relationship between consumer income and expenditure on a particular good, aiding businesses and policymakers in predicting spending patterns and tailoring marketing strategies or social welfare programs accordingly. The Laffer curve demonstrates the relationship between tax rates and tax revenue, guiding governments in designing optimal tax policies that maximize revenue without discouraging economic activity. Understanding these curves helps economists balance consumption behaviors with effective taxation frameworks to promote economic growth and equity.
Limitations and Criticisms
The Engel curve often faces criticism for its assumption of stable preferences, which can lead to inaccurate interpretations when consumer behavior changes over time or across income groups. The Laffer curve is limited by its simplistic representation of tax rates and revenue, as it fails to account for complex economic factors such as tax evasion, labor supply elasticity, and the varying impact of different tax types. Both curves oversimplify real-world economic dynamics, reducing their predictive reliability and practical policy application.
Policy Relevance: Income Distribution and Tax Policy
The Engel curve illustrates changes in household consumption patterns relative to income variations, providing critical insights for designing income redistribution policies that target poverty reduction and equitable consumption. The Laffer curve demonstrates the relationship between tax rates and tax revenue, guiding policymakers in optimizing tax rates to balance revenue generation without discouraging economic activity. Understanding both curves aids in crafting fiscal policies that improve income distribution while maintaining efficient tax structures.
Conclusion: Comparative Insights
The Engel curve illustrates the relationship between consumer income and expenditure on a specific good, highlighting how spending patterns change with income levels, while the Laffer curve depicts the relationship between tax rates and tax revenue, emphasizing the trade-off between taxation and economic activity. Comparative insights reveal that both curves provide critical frameworks for understanding behavioral responses--Engel curves guide consumer demand analysis, whereas Laffer curves inform fiscal policy optimization. Recognizing these distinct yet complementary roles enhances economic modeling and policy decision-making aimed at balancing consumer welfare with government revenue objectives.
Engel curve Infographic