The Phillips curve illustrates the inverse relationship between inflation and unemployment, showing how lower unemployment often corresponds with higher inflation rates. Understanding this economic concept helps you grasp central bank policies aimed at balancing growth and price stability. Explore the rest of the article to see how the Phillips curve influences modern economic decisions.
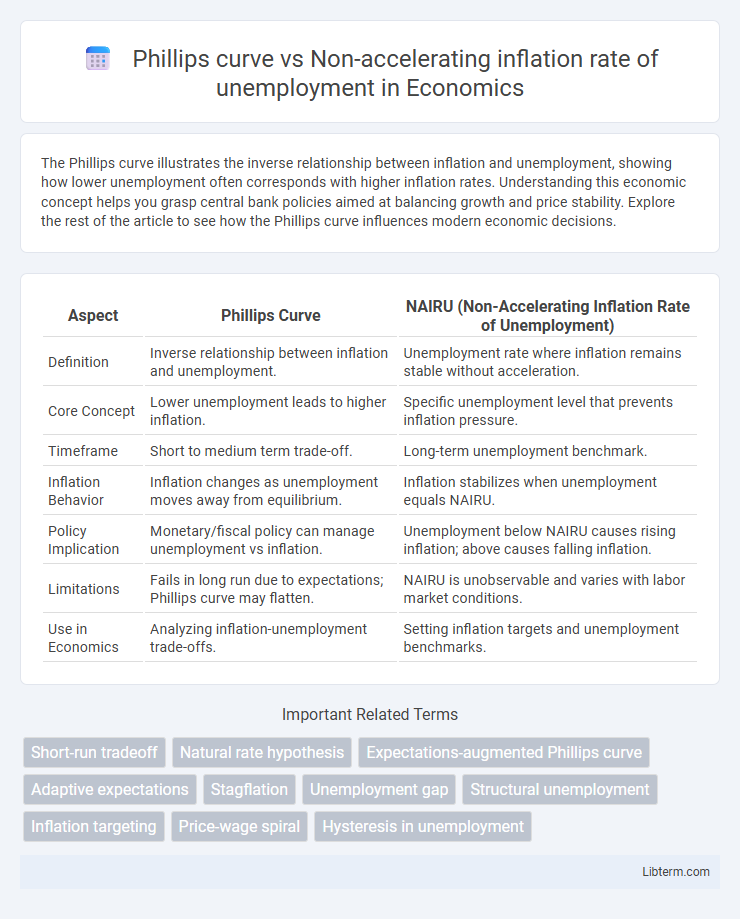
Table of Comparison
| Aspect | Phillips Curve | NAIRU (Non-Accelerating Inflation Rate of Unemployment) |
|---|---|---|
| Definition | Inverse relationship between inflation and unemployment. | Unemployment rate where inflation remains stable without acceleration. |
| Core Concept | Lower unemployment leads to higher inflation. | Specific unemployment level that prevents inflation pressure. |
| Timeframe | Short to medium term trade-off. | Long-term unemployment benchmark. |
| Inflation Behavior | Inflation changes as unemployment moves away from equilibrium. | Inflation stabilizes when unemployment equals NAIRU. |
| Policy Implication | Monetary/fiscal policy can manage unemployment vs inflation. | Unemployment below NAIRU causes rising inflation; above causes falling inflation. |
| Limitations | Fails in long run due to expectations; Phillips curve may flatten. | NAIRU is unobservable and varies with labor market conditions. |
| Use in Economics | Analyzing inflation-unemployment trade-offs. | Setting inflation targets and unemployment benchmarks. |
Introduction to the Phillips Curve
The Phillips Curve illustrates the inverse relationship between unemployment and inflation, suggesting that lower unemployment rates typically coincide with higher inflation. This economic concept highlights the trade-off policymakers face between stimulating job growth and controlling price stability. Understanding this relationship is crucial for analyzing labor market dynamics and inflationary pressures over different economic cycles.
Understanding NAIRU (Non-Accelerating Inflation Rate of Unemployment)
The Phillips curve illustrates the inverse relationship between unemployment and inflation, but this relationship evolves over time due to expectations, leading to the concept of NAIRU--the Non-Accelerating Inflation Rate of Unemployment. NAIRU represents the specific unemployment rate at which inflation remains stable, indicating no upward or downward pressure on prices. Understanding NAIRU is crucial for policymakers to balance inflation control with employment objectives, as unemployment below this rate tends to accelerate inflation, while unemployment above it suppresses inflation growth.
Historical Origins and Development
The Phillips curve, introduced by A.W. Phillips in 1958, demonstrated an inverse relationship between unemployment and wage inflation based on UK data from 1861 to 1957. The Non-Accelerating Inflation Rate of Unemployment (NAIRU) concept emerged in the 1960s and 1970s, refined by economists like Milton Friedman and Edmund Phelps, to address the limitations of the Phillips curve by emphasizing a specific unemployment rate at which inflation remains stable over time. These developments shifted economic policy focus from exploiting unemployment-inflation trade-offs to maintaining unemployment at a level consistent with stable inflation expectations.
Theoretical Foundations: Comparing Phillips Curve and NAIRU
The Phillips Curve illustrates an inverse relationship between inflation and unemployment, suggesting that lower unemployment rates lead to higher inflation due to wage pressures. In contrast, the Non-Accelerating Inflation Rate of Unemployment (NAIRU) represents a specific unemployment level at which inflation remains stable, implying no trade-off between inflation and unemployment in the long run. Theoretical foundations of NAIRU emphasize expectations and structural factors, while the Phillips Curve initially focused on short-run demand-driven inflation dynamics.
Key Assumptions and Limitations
The Phillips curve assumes a stable inverse relationship between unemployment and inflation, implying that lower unemployment leads to higher inflation, while the Non-accelerating Inflation Rate of Unemployment (NAIRU) posits a specific unemployment level where inflation remains constant. Key limitations include the Phillips curve's failure to account for inflation expectations and supply shocks, which can shift or break the relationship, and the difficulty in accurately estimating NAIRU due to its dependence on changing economic conditions and labor market dynamics. Both models rely on assumptions of rational expectations and market adjustments that may not hold in the short term, leading to potential policy misinterpretations.
Empirical Evidence and Real-World Application
Empirical evidence shows the Phillips curve illustrates an inverse short-term relationship between inflation and unemployment, yet this trade-off breaks down in the long run as the non-accelerating inflation rate of unemployment (NAIRU) becomes relevant. Real-world application of NAIRU helps policymakers understand that attempts to push unemployment below this natural rate can lead to accelerating inflation without sustained employment gains. Studies during the 1970s stagflation confirmed the limitations of the Phillips curve, reinforcing NAIRU's role in inflation targeting and monetary policy frameworks globally.
Policy Implications for Monetary and Fiscal Authorities
The Phillips curve illustrates an inverse relationship between unemployment and inflation, suggesting that monetary and fiscal policies can trade off between these variables to manage economic stability. In contrast, the Non-Accelerating Inflation Rate of Unemployment (NAIRU) emphasizes a specific unemployment rate where inflation remains stable, guiding policymakers to avoid pushing unemployment below this threshold to prevent accelerating inflation. Monetary authorities often use interest rate adjustments to target inflation around NAIRU, while fiscal policies focus on structural reforms to influence labor market flexibility and maintain sustainable unemployment levels.
Criticisms and Debates in Economic Literature
The Phillips curve, which posits an inverse relationship between inflation and unemployment, faces criticisms for oversimplifying labor market dynamics and failing to account for inflation expectations, leading to the development of the Non-accelerating Inflation Rate of Unemployment (NAIRU) concept. Critics argue that NAIRU is unobservable, varies over time, and lacks predictive power, fueling debates on its usefulness in monetary policy. Economic literature highlights the challenges in estimating a stable NAIRU and questions whether policy should target unemployment or inflation stabilization independently.
The Phillips Curve and NAIRU in Modern Economies
The Phillips Curve illustrates an inverse relationship between unemployment and inflation, suggesting that lower unemployment rates correspond with higher inflation in modern economies. The Non-Accelerating Inflation Rate of Unemployment (NAIRU) represents the specific unemployment rate at which inflation remains stable, indicating that unemployment below NAIRU accelerates inflation while above it deflates inflation. Understanding the interaction between the Phillips Curve and NAIRU is crucial for central banks in setting monetary policies to achieve stable inflation without triggering excessive unemployment.
Future Perspectives and Evolving Theories
Future perspectives on the Phillips Curve emphasize its diminished predictive power due to globalized labor markets and adaptive inflation expectations, which challenge the traditional trade-off between unemployment and inflation. Emerging theories incorporate the Non-Accelerating Inflation Rate of Unemployment (NAIRU) as a dynamic benchmark, reflecting structural changes such as technological advancements and labor market rigidity. Economists are increasingly integrating behavioral insights and real-time data analytics to refine inflation-unemployment models, aiming for more accurate policy guidance in diverse macroeconomic environments.
Phillips curve Infographic