Standard deviation measures the spread of data points around the mean, indicating how much variation exists within a dataset. It is essential for assessing risk in finance, quality control in manufacturing, and variability in scientific research. Discover how understanding standard deviation can enhance your data analysis efforts by diving deeper into this article.
Table of Comparison
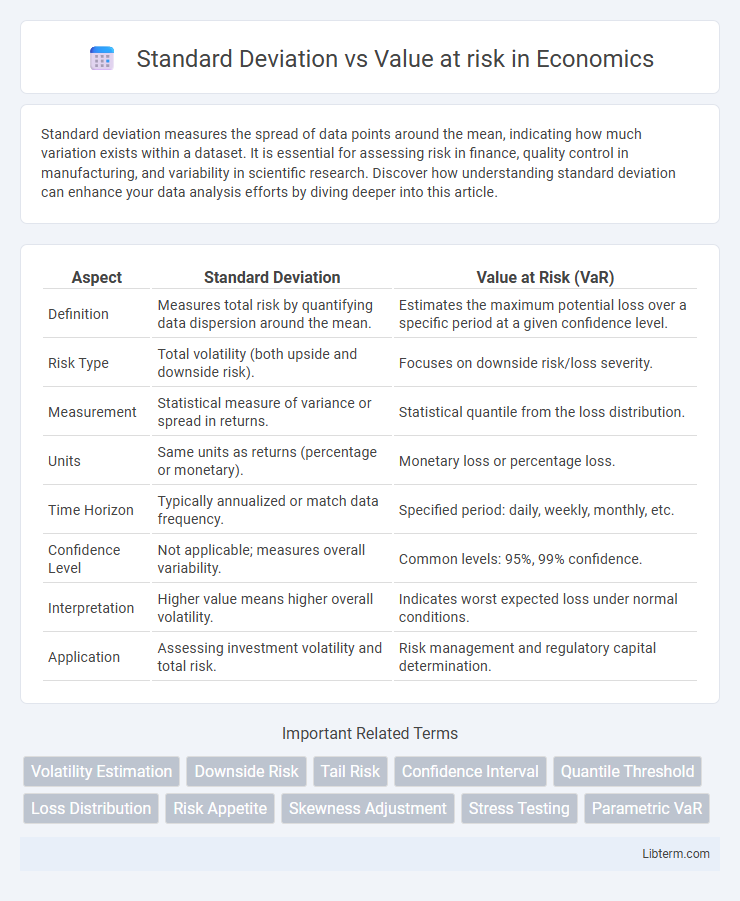
| Aspect | Standard Deviation | Value at Risk (VaR) |
|---|---|---|
| Definition | Measures total risk by quantifying data dispersion around the mean. | Estimates the maximum potential loss over a specific period at a given confidence level. |
| Risk Type | Total volatility (both upside and downside risk). | Focuses on downside risk/loss severity. |
| Measurement | Statistical measure of variance or spread in returns. | Statistical quantile from the loss distribution. |
| Units | Same units as returns (percentage or monetary). | Monetary loss or percentage loss. |
| Time Horizon | Typically annualized or match data frequency. | Specified period: daily, weekly, monthly, etc. |
| Confidence Level | Not applicable; measures overall variability. | Common levels: 95%, 99% confidence. |
| Interpretation | Higher value means higher overall volatility. | Indicates worst expected loss under normal conditions. |
| Application | Assessing investment volatility and total risk. | Risk management and regulatory capital determination. |
Introduction to Standard Deviation and Value at Risk
Standard deviation measures the dispersion of a dataset relative to its mean, quantifying volatility and risk in investment returns by calculating the average deviation from the expected value. Value at Risk (VaR) estimates the maximum potential loss over a specified time period at a given confidence level, providing insights into downside financial risk exposure. Both metrics serve critical roles in risk management, with standard deviation focusing on overall variability and VaR emphasizing extreme loss probabilities.
Understanding Standard Deviation in Finance
Standard deviation in finance measures the volatility or risk of an asset's returns by quantifying the average deviation from the expected value, providing insight into the variability of investment outcomes. Unlike Value at Risk (VaR), which estimates the potential loss over a specific time frame at a given confidence level, standard deviation captures overall historical fluctuations without pinpointing extreme losses. Investors use standard deviation to gauge the consistency of returns and to construct diversified portfolios that balance risk and reward effectively.
What is Value at Risk (VaR)?
Value at Risk (VaR) quantifies the maximum potential loss of an investment portfolio over a specified time frame at a given confidence level, reflecting market risk exposure. Unlike standard deviation, which measures overall volatility, VaR emphasizes the tail risk by estimating the worst expected loss under normal market conditions. VaR is a critical tool for risk management, regulatory compliance, and capital allocation in financial institutions.
Key Differences Between Standard Deviation and VaR
Standard deviation measures the overall volatility of an asset's returns by quantifying the average deviation from the mean, providing a sense of total risk. Value at Risk (VaR) estimates potential financial loss over a specific time frame at a given confidence level, focusing on tail risk rather than general variability. While standard deviation captures both upside and downside fluctuations, VaR specifically targets downside risk exposure, making it more relevant for risk management in finance.
How Standard Deviation Measures Volatility
Standard deviation quantifies the volatility of an asset by measuring the dispersion of its returns from the mean, reflecting the degree of fluctuation over a specified period. It provides a statistical estimate of risk by capturing the variability in historical price movements, which helps investors understand potential deviations from expected returns. Unlike Value at Risk (VaR), which estimates potential losses at a given confidence level over a short horizon, standard deviation offers a broader measure of overall market volatility without specifying loss probabilities.
Interpreting VaR in Portfolio Risk Management
Value at Risk (VaR) quantifies the maximum expected loss in a portfolio over a set time frame at a given confidence level, offering a clear threshold for risk tolerance. Unlike standard deviation, which measures overall volatility around the mean return, VaR focuses specifically on tail risk, highlighting potential extreme losses. Interpreting VaR in portfolio risk management enables investors to allocate capital more effectively by understanding downside risk and preparing for adverse market conditions.
Advantages and Limitations of Standard Deviation
Standard deviation measures total volatility by quantifying the dispersion of returns around the mean, providing a clear metric for overall risk assessment in financial portfolios. It excels in simplicity and applicability across normally distributed datasets but assumes symmetrical distribution of returns, which limits its accuracy in capturing extreme losses or tail risks. Unlike Value at Risk (VaR), standard deviation does not estimate potential maximum losses within a specific confidence interval, making it less effective for stress testing or regulatory capital requirements.
Pros and Cons of Using Value at Risk
Value at Risk (VaR) provides a clear quantifiable metric for potential losses within a specific confidence interval, making it widely used for risk management and regulatory reporting. Its simplicity and ability to aggregate risk across portfolios make it advantageous compared to standard deviation, which measures overall volatility but not specific downside risks. However, VaR can underestimate tail risk, rely heavily on historical data assumptions, and may not capture extreme market events, limiting its effectiveness in stress scenarios.
Practical Applications: When to Use Standard Deviation vs VaR
Standard deviation measures overall volatility, making it ideal for evaluating risk in diversified investment portfolios and assessing historical return variability. Value at Risk (VaR) quantifies potential losses at a specific confidence level within a given time frame, which is essential for daily risk management, regulatory compliance, and stress testing in financial institutions. Use standard deviation for long-term risk assessment and portfolio optimization, whereas VaR is more suitable for short-term risk limits and downside risk estimation.
Conclusion: Choosing the Right Risk Measure
Standard deviation measures overall volatility, quantifying the average deviation from the mean, making it suitable for assessing total risk in normally distributed returns. Value at Risk (VaR) estimates potential losses over a specific time frame at a given confidence level, capturing tail risk and providing more practical insights for downside risk management. Selecting the right risk measure depends on the investment context: standard deviation is ideal for evaluating total variability, while VaR better serves risk-averse strategies prioritizing potential worst-case losses.
Standard Deviation Infographic