Poisson distribution models the probability of a given number of events occurring within a fixed interval, assuming these events happen independently and at a constant average rate. It is widely used in fields like telecommunications, traffic flow, and natural phenomena to analyze rare events. Explore the rest of the article to understand how the Poisson distribution can be applied effectively in your data analysis.
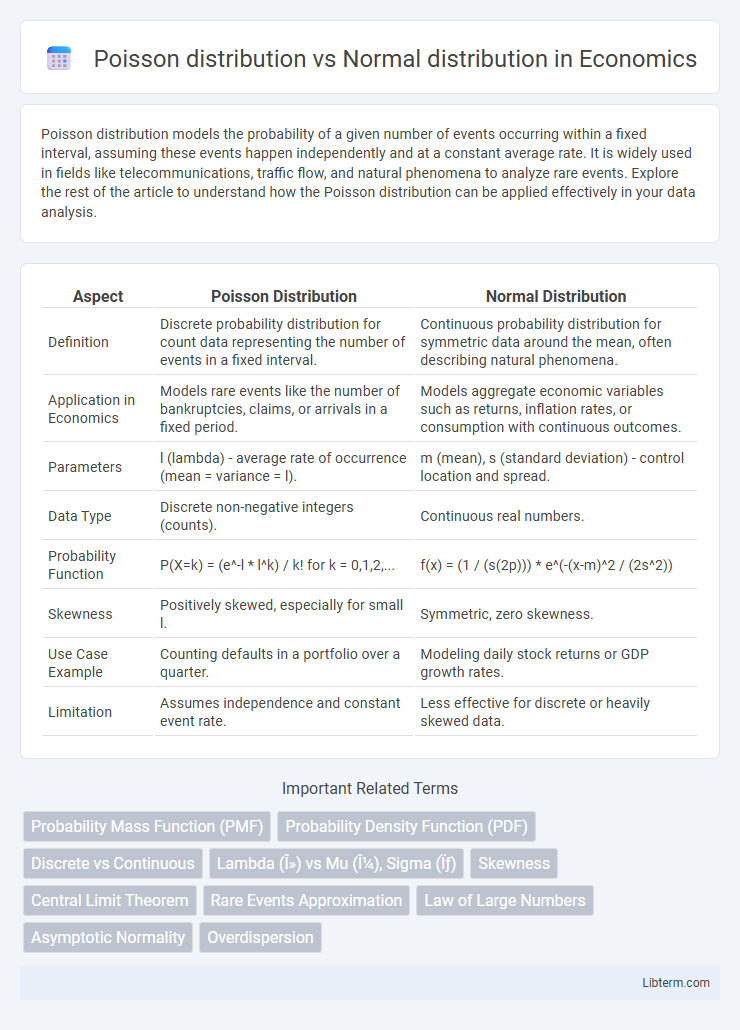
Table of Comparison
| Aspect | Poisson Distribution | Normal Distribution |
|---|---|---|
| Definition | Discrete probability distribution for count data representing the number of events in a fixed interval. | Continuous probability distribution for symmetric data around the mean, often describing natural phenomena. |
| Application in Economics | Models rare events like the number of bankruptcies, claims, or arrivals in a fixed period. | Models aggregate economic variables such as returns, inflation rates, or consumption with continuous outcomes. |
| Parameters | l (lambda) - average rate of occurrence (mean = variance = l). | m (mean), s (standard deviation) - control location and spread. |
| Data Type | Discrete non-negative integers (counts). | Continuous real numbers. |
| Probability Function | P(X=k) = (e^-l * l^k) / k! for k = 0,1,2,... | f(x) = (1 / (s(2p))) * e^(-(x-m)^2 / (2s^2)) |
| Skewness | Positively skewed, especially for small l. | Symmetric, zero skewness. |
| Use Case Example | Counting defaults in a portfolio over a quarter. | Modeling daily stock returns or GDP growth rates. |
| Limitation | Assumes independence and constant event rate. | Less effective for discrete or heavily skewed data. |
Introduction to Poisson and Normal Distributions
The Poisson distribution models the probability of a given number of events occurring in a fixed interval of time or space when these events happen independently with a known constant mean rate, commonly applied in fields like telecommunications and traffic flow analysis. The Normal distribution, characterized by its symmetric bell curve defined by mean and standard deviation, describes continuous data and underpins many natural phenomena due to the Central Limit Theorem. Both distributions serve distinct purposes: Poisson for discrete event counts and Normal for continuous variable modeling.
Key Characteristics of Poisson Distribution
The Poisson distribution models the probability of a given number of events occurring within a fixed interval when events happen independently and at a constant average rate, characterized by the parameter l (lambda), which represents both the mean and variance. It is discrete and skewed, often used for count data with rare events, contrasting with the Normal distribution's continuous, symmetric, and bell-shaped curve suitable for large sample sizes and data with fixed mean and variance. The Poisson distribution's key properties include its mean equal to the variance and applicability in fields like telecommunications, biology, and traffic flow analysis.
Key Characteristics of Normal Distribution
The normal distribution is a continuous probability distribution characterized by its symmetric bell-shaped curve centered around the mean, with data tapering off equally in both directions. It is fully described by two parameters: the mean (m), which defines the center, and the standard deviation (s), which measures the spread or dispersion of data. Unlike the discrete Poisson distribution, the normal distribution models continuous data and is used extensively in statistical inference due to the central limit theorem, which ensures that sums of independent random variables approximate normality for large sample sizes.
Mathematical Formulation: Poisson vs Normal
The Poisson distribution is characterized by the probability mass function \( P(X = k) = \frac{\lambda^k e^{-\lambda}}{k!} \), where \( \lambda \) represents the average rate of occurrence within a fixed interval and \( k \) is the number of events. The Normal distribution is described by the probability density function \( f(x) = \frac{1}{\sigma \sqrt{2\pi}} e^{-\frac{(x-\mu)^2}{2\sigma^2}} \), with parameters mean \( \mu \) and standard deviation \( \sigma \). While Poisson models discrete event counts over time or space, the Normal distribution approximates continuous data and, under certain conditions, the Poisson distribution approaches Normal when \( \lambda \) is large.
Real-World Applications of Poisson Distribution
Poisson distribution models the probability of a given number of events occurring within a fixed interval, making it ideal for predicting rare events in fields like telecommunications for call arrivals, traffic engineering for vehicle counts, and healthcare for patient admission rates. Unlike the Normal distribution, which assumes continuous data and symmetric variability, the Poisson distribution handles discrete count data with potentially skewed distributions and low mean values. This makes Poisson distribution particularly valuable for inventory management, insurance claim modeling, and natural disaster occurrence predictions where event counts are low and occur independently.
Real-World Applications of Normal Distribution
Normal distribution is widely applied in quality control and finance, where it models measurement errors and asset returns due to its symmetric, bell-shaped curve. It plays a key role in natural and social sciences for representing real-world variables like heights, test scores, and IQ, which cluster around a mean. This distribution's continuous nature and defined parameters make it ideal for statistical inference and probabilistic predictions across diverse fields.
Key Differences Between Poisson and Normal Distributions
Poisson distribution models the probability of a given number of events occurring in a fixed interval of time or space, characterized by a single parameter l representing the average rate, and is discrete in nature. Normal distribution is continuous, defined by two parameters--mean (m) and standard deviation (s)--and describes data symmetrically around the mean with a bell-shaped curve. Poisson is used for count-based, rare event data often skewed to the right, while Normal suits continuous data with symmetric variability and assumes underlying data follows a Gaussian pattern.
When to Use Poisson vs Normal Distribution
Use the Poisson distribution for modeling the count of rare, discrete events occurring within a fixed interval, especially when the event rate is low and the number of trials is large. The Normal distribution is appropriate for continuous data or large sample sizes where the Central Limit Theorem ensures the data approximates a bell-shaped curve. When the mean of a Poisson distribution is large, it can be approximated by a Normal distribution to simplify calculations.
Visual Comparison: Shape and Properties
The Poisson distribution is discrete and typically skewed right for smaller mean values, exhibiting a peak near zero and a tail extending toward larger counts, while the Normal distribution is continuous and symmetric, characterized by its bell-shaped curve centered around the mean with spread determined by the standard deviation. As the Poisson mean increases, its shape approximates the Normal distribution due to the Central Limit Theorem, with variance equal to the mean distinguishing Poisson's fixed mean-variance relationship from the Normal's independent parameters. Visual comparisons highlight the Poisson's step-like probabilities compared to the smooth curve of the Normal, emphasizing differences in skewness, continuity, and tail behavior.
Summary and Conclusion
The Poisson distribution models the probability of a given number of events occurring in a fixed interval of time or space, typically suited for rare or discrete event counts with a known average rate (l). The Normal distribution describes continuous data with a symmetric bell-shaped curve, characterized by its mean (m) and standard deviation (s), and is often used for large sample sizes or when data tend to cluster around the mean. While the Poisson distribution approximates discrete event counts, the Normal distribution is ideal for modeling continuous variables and can approximate the Poisson distribution when the event rate is large, providing a versatile tool for statistical analysis.
Poisson distribution Infographic