The normal distribution, also known as the Gaussian distribution, is a fundamental concept in statistics characterized by a symmetric bell-shaped curve centered around the mean. It describes how data values are distributed, with most observations clustering around the average and fewer appearing as they move away from the center. Explore the article further to understand how the normal distribution impacts your data analysis and decision-making.
Table of Comparison
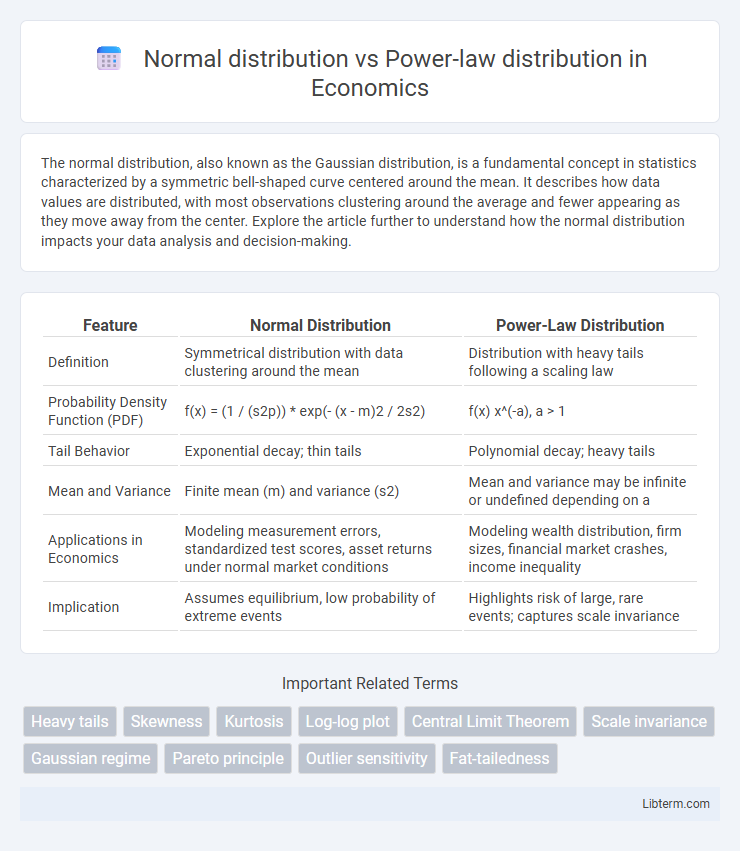
| Feature | Normal Distribution | Power-Law Distribution |
|---|---|---|
| Definition | Symmetrical distribution with data clustering around the mean | Distribution with heavy tails following a scaling law |
| Probability Density Function (PDF) | f(x) = (1 / (s2p)) * exp(- (x - m)2 / 2s2) | f(x) x^(-a), a > 1 |
| Tail Behavior | Exponential decay; thin tails | Polynomial decay; heavy tails |
| Mean and Variance | Finite mean (m) and variance (s2) | Mean and variance may be infinite or undefined depending on a |
| Applications in Economics | Modeling measurement errors, standardized test scores, asset returns under normal market conditions | Modeling wealth distribution, firm sizes, financial market crashes, income inequality |
| Implication | Assumes equilibrium, low probability of extreme events | Highlights risk of large, rare events; captures scale invariance |
Introduction to Probability Distributions
Probability distributions describe how values of a random variable are distributed, with normal and power-law distributions being fundamental types. The normal distribution, also known as Gaussian distribution, is characterized by its symmetric bell-shaped curve determined by mean and standard deviation, representing many natural phenomena with values clustering around the mean. In contrast, the power-law distribution features heavy tails indicating a higher likelihood of extreme events, often observed in phenomena such as wealth distribution, earthquake magnitudes, and network connectivity.
What is a Normal Distribution?
A Normal distribution, also known as a Gaussian distribution, is a continuous probability distribution characterized by a symmetric, bell-shaped curve centered around its mean, where most data points cluster near the average value. It is defined by two parameters: the mean (m), indicating the distribution's central location, and the standard deviation (s), which quantifies the spread or variability of the data. Normal distributions are fundamental in statistics and natural phenomena due to the Central Limit Theorem, which states that the sum of many independent random variables tends toward a normal distribution regardless of the original variables' distributions.
Understanding Power-law Distributions
Power-law distributions are characterized by heavy tails where extreme events have higher probabilities compared to normal distributions, which exhibit exponential decay in tails. Understanding power-law distributions is essential in fields like physics, economics, and network science because they model phenomena such as wealth distribution, earthquake magnitudes, and internet topology. Unlike the symmetric bell curve of normal distribution, power-law patterns reveal scale invariance and self-similarity in data, indicating that small occurrences are extremely common while large occurrences are rare but significant.
Key Differences: Normal vs Power-law
Normal distribution features a symmetric bell curve where data clusters around a mean with rapidly decreasing probabilities for extreme values, characterized by finite mean and variance. Power-law distribution exhibits a heavy tail with scale-invariance, allowing for significant probabilities of extreme events and often lacks finite moments such as mean or variance for certain parameter ranges. Key differences include the decay rate of tail probabilities--exponential in normal versus polynomial in power-law--and the implications for risk, with power-law distributions modeling phenomena like wealth concentration, natural disasters, and network connectivity that normal distribution cannot capture effectively.
Mathematical Properties Compared
Normal distribution is characterized by its symmetric bell-shaped curve defined by mean (m) and standard deviation (s), with probabilities declining exponentially from the center, ensuring finite moments of all orders. Power-law distribution follows the form P(x) ~ x^(-a) with a > 1, exhibiting heavy tails that decay polynomially, leading to infinite variance when a <= 2 and undefined higher moments. Unlike the normal distribution's fixed scale and exponential decay, power-law distributions display scale invariance and lack a characteristic scale, making them suitable for modeling extreme events and phenomena in complex systems.
Real-World Examples of Each Distribution
Normal distribution is commonly observed in natural phenomena such as human height, blood pressure, and measurement errors, where values cluster symmetrically around a mean. Power-law distribution appears in real-world contexts like earthquake magnitudes, city population sizes, and wealth distribution, characterized by a heavy tail indicating a few large events dominate frequency. These distinct patterns reflect underlying processes: normal distribution arises from additive effects of many independent factors, while power-law emerges from multiplicative growth and preferential attachment mechanisms.
Implications in Data Analysis
Normal distribution assumes symmetry and a predictable spread around the mean, making it suitable for many standard statistical methods and hypothesis testing in data analysis. Power-law distribution, characterized by heavy tails and scale invariance, often indicates the presence of rare but significant events, requiring specialized techniques such as log-log plotting and robust outlier detection. Choosing the correct distribution model directly impacts the accuracy of predictive analytics, anomaly detection, and risk assessment in big data environments.
Choosing the Right Distribution Model
Choosing the right distribution model depends on the underlying data characteristics and application goals. Normal distributions are ideal for symmetric data with a well-defined mean and variance, frequently used in natural phenomena and measurement errors. Power-law distributions are preferable for modeling data with heavy tails and scale invariance, such as wealth distribution, internet traffic, and social network connectivity, where extreme events have significant impact.
Common Misconceptions and Pitfalls
Normal distribution is often mistakenly assumed to describe data with large outliers, but power-law distribution more accurately models phenomena with heavy tails, such as wealth or internet traffic. A common pitfall is using mean and variance from normal distribution to summarize power-law data, leading to misleading conclusions due to infinite variance characteristics. Misinterpreting a straight line on a log-log plot as proof of a power-law without rigorous statistical testing can result in incorrect identification of distribution type.
Conclusion: Significance in Statistics
Normal distribution models data with central tendency and symmetrical variability, making it essential for inferential statistics and hypothesis testing. Power-law distribution captures phenomena with heavy tails and scale invariance, crucial for understanding systems with extreme events or outliers. Recognizing the appropriate distribution type ensures accurate data modeling, risk assessment, and decision-making in statistical analysis.
Normal distribution Infographic